21 Dec 2023

Results run Cross de Invierno A.D. Ciudad de los Poetas 2023 Madrid


#88 Results run Cross de Invierno A.D. Ciudad de los Poetas 2023 Madrid


Last Sunday 17/12/2023 was the yearly run 'Cross de Invierno' organized by A.D. Ciudad de los Poetas, in the nice park in my neighbourhood Dehesa de la Villa, Madrid.
For more information about this race, see e.g:

http://adcpoetas.blogspot.com/2023/12/xxxix-cross-de-invierno-clasifiaciones.html

https://youtu.be/WMnQjA7h1oE?si=8O8uilxO4RrOw32O

https://runedia.mundodeportivo.com/carrera/cross-de-invierno-ciudad-de-los-poetas-2023/20233350/ 

or my previous blog-posts about earlier editions of this run, e.g.:

https://worktimesheet2014.blogspot.com/2018/12/data-analysis-for-finishing-times-of.html


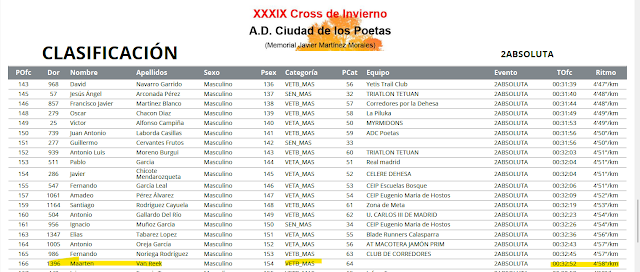
For this blog post I made an Excel with the finish-times of the category that I participated in (male, Veterans B), based on this doc/PDF:

https://drive.google.com/file/d/1hcRWlKO9PAoV70GVajWZ79Wn7_YwzCQx/view?usp=drive_link

NB: the table-headers in this doc are in Spanish and abbreviated, but in my Excel, in sheet 'Fields' you can find the English descriptions.

This is my Excel (in desktop version):


I've also uploaded this Excel to One Drive and generated the iframe HTML-code to embed this Excel (online version) in this blog (see the bottom of this post).
How-to: https://www.youtube.com/watch?v=uvA-U9FKgPw

In the right bottom histogram-chart you can see that my finish time (00:32:52) is somewhere in the middle, in bin '31:33-33:08' (rank #64 of the in total 113 Veterans B runners).


Steps to make this histogram:

*step 1: calculate finish-time in # seconds, see column O (sheet 'MenAll')


*step  2: for the finish-times (in sec.), generate the bins of the histogram with the 'Data Analysis' function.

How-to: https://www.upwork.com/resources/how-to-make-histogram-in-excel


*step  3: create the bin-labels to use in the histogram (see blue cells in pic above)

How-to:

https://youtu.be/QQGkrYzRbm8?si=t7FeHecvY4Hvyt-M

https://stackoverflow.com/questions/220672/convert-time-fields-to-strings-in-excel

 
*step  4: insert (clustered) column chart (select blue cells in pic above)


On the website of A.D. Poetas you can also find all the photos that were made during the race,
which are a lot (6000). But luckily it has the 'image-search' feature (as e.g. Google Photos), and so I could find easily this nice photo of the run of my kids in this album:


or of my race:
https://frutocfotos.barrel.cloud/en-en/album/photo/c731b368-9da4-41d5-b1ed-8bf57adc3734

Thanks A.D. Poetas for the perfect organization again and giving us a nice sporty Sunday morning.


If you enjoyed this post and want to make a small donation, you can do this with the Paypal Donate button (at the top right of this post) or via BuyMeAcoffee .


Downloads

#1: Excel on One Drive (best option, as both are Microsoft products)

#2: Excel on G-drive


 Embedded Excel

--


--


18 Sept 2023

Messi / Inter Miami / Major League Soccer - Power BI dashboard

#87 Messi / Inter Miami / Major League Soccer - Power BI dashboard 

Now Messi went to the USA to play for Inter Miami in the Major League Soccer (MLS), I wanted to know more about this club and competition and decided to make Power BI dashboard for it, after having updated my Looker/Google Data Studio dashboard 'Messi Goal Tracker' to include his goals for Inter Miami (see this post)

I googled on MLS and API and found this nice API website:

https://sportsdata.io/developers

from which you can get data for free for a big part, although some data is scrambled and only available if you pay)

With the data of some of the API-endpoints of this site I was able to create this dashboard:


In this pic you can see 2 pages of the dashboard:

-1: the competitions Inter Miami plays in, so beside MLS also the League Cup (international competition with besides clubs from the USA also clubs from Mexico and Canada)

-2: bubble-chart with total number of US-clubs in MLS per US-state.

And here some pics of other pages in the dashboard:

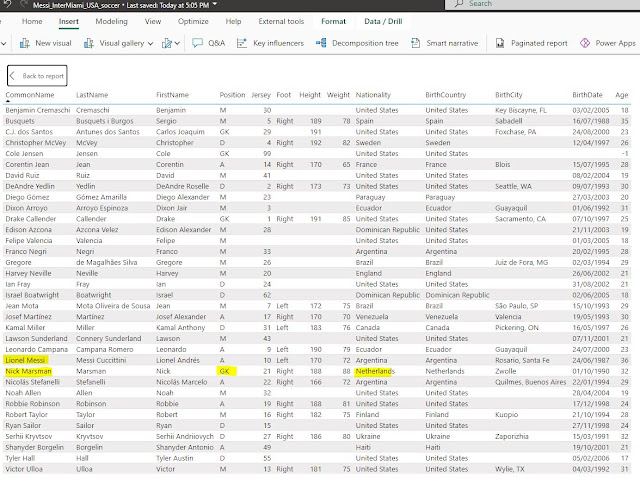
This ArcGIS filled map shows the number of players from Inter Miami that come from that country  (lighter color in map means higher value), which shows e.g. that there is one Dutch player, Nick Marsman (played before for Feyenoord), although this info looks to be outdated (Marsman already left Miami). And with a right-click on a country, you activate the drill-through feature that leads you to another page of the report, with player-info, that is pre-filtered with the country that you selected.

And here the full details of the MLS-teams and of the Inter Miami-players:


Some more details about the datasource of this dashboard, so the Sportsdata.io soccer API-endpoints:

https://sportsdata.io/developers/api-documentation/soccer

 https://sportsdata.io/developers/api-documentation/soccer#/endpoint/competition-fixtures-league-details


The API-endpoints I needed, I stored it API-tool Postman.
NB: for a Postman-tutorial, see e.g. this video

And this API-call information I then copied from Postman to Power BI, in datasources of type 'Web', including the parameters of the API-call, e.g. team Inter Miami = 2363:

NB:

For some more details on how to work with parameters in Power BI / Power Query, see e.g.:

https://learn.microsoft.com/en-us/power-query/power-query-query-parameters

https://msdynamicsworld.com/story/use-parameters-and-custom-functions-call-apis-power-bi


Messi shows he is still in a good shape, see e.g. his first goal for Inter Miami, and David Beckham's reaction:

https://www.cbssports.com/soccer/news/lionel-messi-scores-dramatic-94th-minute-winner-in-inter-miami-debut-against-cruz-azul-in-leagues-cup/live/

https://www.tiktok.com/@_forca_barca/video/7258589957751655682

Here's the API-output (json-format) for that goal:


MLS soccer will be happy that Messi has chosen for the US to finish his career as earlier other soccer legends did, as Cruyff, Pele, Beckenbaur and more recently, Beckham, see:

https://en.prothomalo.com/sports/football/38nc6f2jmd


Embedded Power BI dashboard

 NB: I also published it on the Power BI Data Stories Gallery:

Messi / Inter Miami / Major League Soccer - Power ... - Microsoft Fabric Community


Download  

Power BI Dashboard


15 May 2023

Power BI report Team Feyenoord Rotterdam, champion Dutch League Eredivisie 2022/23

#86  Power BI report Team Feyenoord Rotterdam, champion Dutch soccer league  Eredivisie 2022/23

 
Feyenoord has become the Dutch champion ('landskampioen') of the Dutch soccer leage Eredivisie, season 2022/23, something that at the beginning of the season almost nobody expected.
Read this nice article from NRC on how the trainer Arne Slot and his young, international team (players average age is under 24 years, and they come from 16 different countries) managed to do this.

I made this Power BI report to visualize this data of the team, using this datasource: 

https://www.worldfootball.net/teams/feyenoord/2023/2/


For the embedded, interactive Power BI-report, see the end of this post, or see my post on Microsoft Power BI Community - Data Stories Gallery , where I found also this nice Power BI report about with the all-time ranking of clubs in Eredivisie, which looks like this for Feyenoord:

https://community.powerbi.com/t5/Data-Stories-Gallery/Insights-in-the-Dutch-Football-competition-Eredivisie/m-p/1387418


To get the data in the shape needed to make this report, I did these transformations in Power Query/M:


If you want to have the same statistics for another team, you can copy my report (see par. Download below) and you only have to adapt this M-code.
And if you do so, it would be nice if you'd leave a comment below, with a screenshot of your report if possible.


Downloads

Download Power BI-report


Power BI embedded report

NB: for how to interact in a report, see this guide and this video.


27 Feb 2023

Google Sheets to plan and track a Strava challenge of running 100 km per month


 #85: Google Sheets to plan and track a Strava challenge of running 100 km per month

 
Visma Labs Spain, the company I work for, organized in December (2022) an event for our Strava Running Club: for every km ran/walked (and registered in Strava), the company would donate 0.5 euro to the Madrid Food Bank , with a max. of 1000 euro. So to get to this 1000 euro, we should run in total 2000 km. So if 20 people of our Strava Running Club would participate, that would mean 100 km per runner. So I set for myself this goal: run 100 km in Dec. I saw in Strava there was also this challenge "December Running Challenge, 100 km of running in one month", in which I also participated.
Soon in December, it was clear from the Strava weekly totals from our Strava Running Club, that we would not make the 2000 km in Dec., and it was decided to give us another month, January, for which I also set then a 100 km goal. In January we also did not reach the 2000 km, but in the last extension in  February, we reached the goal, so we got the 1000 euro for the Food Bank. Great work, fellow-runners!

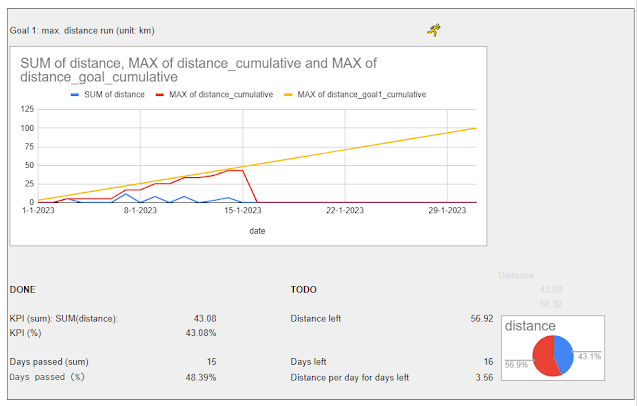
For this 2x 100 km  challenge, I made a spreadsheet in Google Sheet 2 that has time series charts: one  for the planned cumulative distance (with approx. 3 km a day) and another with the real cumulative distance, so it would be easily visible if I was still on track. Here an example with the status of my 100 km challege on 15/1/2023:

NB:

-yellow line: planned cumulative distance

-red line: real cumulative distance, which is on 15/1/2023 under the red line, so I was on track.

-blue line: real distance per day

- the pie-chart shows % distance left (red) vs distance run (blue).
NB: % and km ran/left are same values as goal-distance = 100 km.
 
Here the sheet/tab in which I entered each day the km's of each run (in red):


The G-Sheets version for Jan.2023 has also data for a 2nd Strava-challenge in which I participated, which goal was not distance related (100 km in a month), but time-related (230 minutes of activity in 3 weeks). This data is stored in columns I,  J etc. and the related sheets/tabs have name '..goal2'


After completing of the 2x 100 km challenge, I made also another G-Sheets char to see the total km's of these 2 months:

This G-Sheets imports the data from the Dec.22 and Jan.23 G-Sheets by using function IMPORTRANGE
and combines the data of these 2 month (sheets) by using the function QUERY. For more info about these 2 functions, see:

https://support.google.com/a/users/answer/9308940?hl=en 

https://blog.coupler.io/combine-sheets-into-one/#Combine_sheets_into_one_using_QUERY_Google_Sheets


When I run the function Explore (that uses Machine Learning to help to get insights in the data), it gave me this result/answer:

So it says that my median distance was higher in Jan. than in Dec., which is correct, because in Dec. there were days when I did several runs on a day, each run of a short distance (which I did not do in Jan.).


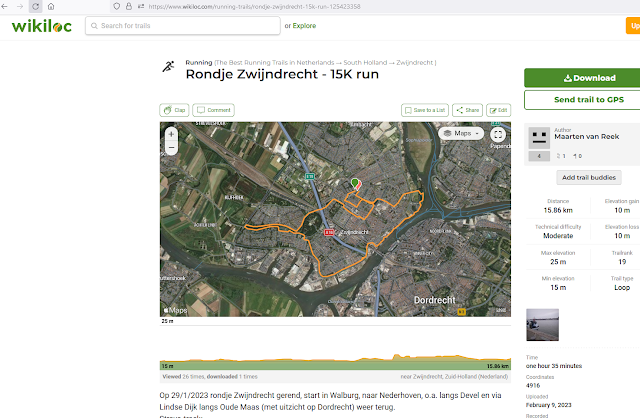
To make the 100 km challenge of Jan.2023, I did one big run at then end of the month, 15 km, in  the city where I grew up, Zwijndrecht (Netherlands), which I also uploaded on this nice Google Maps mashup Wikiloc (a Spanish product that has now 11M members sharing routes):

https://www.wikiloc.com/running-trails/rondje-zwijndrecht-15k-run-125423358

And 2 other specials runs where these 2 races (see also references R1,2):

*1
XXXVIII Cross de invierno A.D. Ciudad de los Poetas 2022, Parque Dehesa de la Villa, Madrid, 6K run in a park close to where I live:

https://www.strava.com/activities/8261806442

*2
San Silvestre Vallecana 10k 2022 31 Dec. Madrid, 10K run, the best christmas-gift from my work (who paid the registration-fee and also for the children of employees who wanted to run the
San Silvestre Mini):

https://www.strava.com/activities/8318453460

This race is not just for fun, it also supports foundations that fight agains childhood cancer (Unoentrecienmil) and childhood obesity (Gasol Foundation):

https://www.sansilvestrevallecana.com/dorsal_solidario_en.php

Thanks to this post on Wikipedia I learned that this 'last race of the year' tradition is not just something in Madrid, but also in other countries as Brazil (where it has its roots), Portugal and Italy.
And in this article of Runnersworld I saw that also in the Netherlands (Soest) there is a Sylvester by Night run/cross.


The goal of running 100 km a month was challenging, but knowing it was a good cause (the food-bank), I was determined to complete it. As I heard Jordan Peterson saying in this talk How to Set Goals the Smart Way (min.9:35): 

"He who has a why can bare almost any how", a line from Nietzsche. I checked for the original phrase (in German) which has a nice addition:

"Hat man sein warum? des Lebens, so verträgt man sich fast mit jedem wie? - Der Mensch strebt nicht nach Glück; nur der Engländer tut das."

https://beruhmte-zitate.de/zitate/123955-friedrich-nietzsche-hat-man-sein-warum-des-lebens-so-vertragt-man-si/


If my spreadsheet is usefull for you, it would be nice if you could share how you used it in a (non-anonymous *) comment below.
* I ask for non-anonymous comments because when I allowed also anonymous comments, I got a lot of spam.


                                                            source pic: https://rb.gy/mqqxl2


Credits

The runner-icon that I used in my G-Sheets is from:
https://www.flaticon.com/free-icon/running_233064?related_id=233064&origin=search


Downloads

NB:

I made the G-Sheets on the G-Drive of my work (to share it with other collegue-runners), but unfortunatley it was not possible to copy the file to my personal G-Drive in the original format (.gsheet). When downloading it, it was converted to Excel, and when I then uploaded to my personal G-Drive and saved it back to G-Sheets format, some things were not exactly the same as in the original G-Sheets (e.g. pivot-charts).

G-Sheet Dec.2022

G-Sheet Jan.2023

NB: see also "Embeded G-Sheets" below, and for more info on how to publish a G-Sheets (generated the embedded code/i-frame), see:
https://www.youtube.com/watch?v=cHXpCaZA7Bw


References

[R1]

Race Dehesa de la Villa:

http://adcpoetas.blogspot.com/p/xxxi-cross.html

https://www.flickr.com/photos/adcpoetas/52571583846/in/album-72177720304540380/

https://www.flickr.com/photos/adcpoetas/52580444869/in/album-72177720304677763/ 

https://sportmaniacs.com/es/races/xxxviii-cross-ciudad-de-los-poetas-2022/639f02a1-36bc-4cca-8f89-7c95ac1f25e6/results/athlete/199/results


[R2] 

Race San Silvestre

https://www.sansilvestrevallecana.com/popular_en.php

https://www.marca.com/atletismo/san-silvestre-vallecana/resultados/carrera-popular.html?utm_source=pocket_saves 

https://www.facebook.com/sansilvestrevallecana/videos/565301878370053/      

https://www.facebook.com/100064108532446/videos/3079732918986087/?__so__=permalink              

https://www.flickr.com/photos/158376798@N03/52601367997/in/album-72177720304924953/

https://www.flickr.com/photos/158376798@N03/52602372703/in/album-72177720304924953/

https://www.marca.com/atletismo/san-silvestre-vallecana/2022/12/28/63ac03d1268e3e39138b45ad.html 

https://www.sansilvestrevallecana.com/diploma22/imprimir.php?id=0caca9a1-fa2a-5c46-a0ed-32f8aa3987e9


[R3]
https://www.chasetheladder.com/

The free version of Strava keeps the total km-run per week, so on Monday you start at 0 again.
But this nice Strava add-on solves that, it adds to each activity (run) some stats as 4-week summary.


[R4]

SMART goal setting

https://www.mindtools.com/a4wo118/smart-goals

https://www.youtube.com/watch?v=PCRSVRD2EAk


[R5]

Running 100 km a month

https://www.asinglestep.co.uk/resources-and-inspiration/running-100km-in-30-days/

https://medium.com/@ikemoobioha/6-life-lessons-i-learned-from-running-100k-in-a-month-29e75a900aa8


Embedded G-Sheets