30 May 2014

Match, Access app to track World Cup Soccer 2014

#18  Match, Access application to track World Cup Soccer 2014


Note 29-7-2014:
I updated the Match-database (MDB-file)  with all the match-results and made a backup of the file after every phase, which you can find (as a zip) in par. Downloads. I refer to this MDB with V2 and to the original MDB with V1. In part 2 of this blog you can see the results, in which I used the match Spain - Netherlands (..) to show which match-data you can registrate in Match.


Part 1 (before start Worldcup):


The Excel-reports for the 2014 FIFA Worldcup Brazil from my previous post, see:

http://worktimesheet2014.blogspot.com.es/2014/05/excel-with-match-schedule-for-2014-fifa.html


were generated by Match, a program I made some time ago to track the UEFA Eurocup and FIFA Worldcup competitions, and which I offer you for free to do the same for the 2014 Worldcup (see Downloads below).


I made Match with MS Access 97. MS Access is  (like MS Excel) part of MS Office (although it is not included in the cheaper Office-versions). If you don't have Access on your PC, don't worry, because Match includes the Access (97)-runtime, which means that once you have installed Match, you also have Access (or I should say: you have the Access-components which Match needs, e.g. the Jet database engine). And if you wonder if a program from 1997 still works in 2014, I can tell you I tested it on 3 PC's: 
- Windows XP with Office 97 Profesional (with Access)
- Windows 7 with Office 2010 Starter (without Access)
- Windows 8 with Office 2013 Profesional  Plus (without Access installed)
and on all 3 PC´s Match worked OK.

Although this blog is about MS Excel, I wanted to make an exception in this post and tell you something about MS Access.

Access is a desktop relational database application. See post #13 for more about relational databases:

http://worktimesheet2014.blogspot.com.es/2014/04/excel-and-relational-databases.html


With Access you build quite easily an application, type 'Windows-desktop'. And because all Office-applications have OLE Automation, they can easily 'communicate' with each other, a feature which I used to generate the Excel-reports from Access (Match). And Access it's own reports you can export in e.g. RFT-format, which you can read in MS Word. 
Access offers you the possiblity to split your application in 2 parts: a Front-End (MDE) executable ('client'), which has the user-forms and logic (functions) and a Back-End, the (MDB) database ('server'). I used this for Match, so it has a 'client-server' architecture: Match_v6_FE.mde is the client (Front-End) and Match_v6_BE.mdb (Back-End) is the server.

Let me now tell you something about Match. 
Match is software with which all 'administrative tasks' for a sport-competitions can be automated, like:
 * making a match-schedule 
 * registrate the match-results (goals, players who scored, yellow/red cards etc)
 * calculating ranking teams and topscorer-list 
 * generating reports in both textual and graphical format, e.g. a match-schedule with locations on y-axis and dates on x-axis.
* betting on match-results and teams for rank 1,2,3, 4 in e.g. Worldcup

As I said before, I originally made Match to track Euro/Worldcup competitions, but Match can be used for every simular competition. To illustrate this: once I made a 'tailor made' version of Match for a big school-soccer tournament in the Netherlands see:

http://www.rotarystreetsoccer.nl/

and for some reports generated by Match:

Some statistics of this tournament 'Rotary Street Soccer Oldenzaal': 18 schools and about 300 teams, more than 2000 children who play about 700 matches. 


But now about the Match version for 2014 FIFA Worldcup Brazil. I already filled Match with the whole match-schedule (so not only the matches in phase 1 (qualifications), but also the 'virtual matches' in the final-phases (1/8-final, 1/4-final etc) and all the teams (and all the 32 flags...). So if you want to use Match to track the Worldcup, you only have to enter the match-results (see fig.1 for the form where you must input the match-results) and use the functions to copy the teams who qualified in round N to round N+1. 


fig.1: Form to input match-results (blue fields)


For more details about how to use Match, see these user-manuals:


* User Manual Match for Worldcup 2014:

http://www.scribd.com/doc/227239062/Match-v6-UserManual-for-WorldCup2014


* User Manual Match (general):
* User Manual for organizing a Worldcup-Pool (betting) with Match:
Before this 'release' I tested Match by doing a simulation of the whole tournament, that is: I entered (random) scores for all matches, and I made a backup of the database (MDB-file) at the end of every phase. I included this database-backups, see  Downloads.  So if you want to see the result of my simulation of the Worldcup at the end of phase X, you must change the name of the backup-file for phase X to 'Match_v6_BE.mdb'. In fig.2 you can see how Match looks like before the begin of the tournament And for the final-result of my simulation, see fig.3 (from file 'Match_v6_BE_Phase5_end.mdb'), which shows in my prediction, the winner of this Worldcup will be  ... Brazil, beating Spain with 1-0 (see Match ID 64).

To end this post with Excel again: 
A nice Excel with which you can also track the Worldcup (and which I used to validate the results of my simulation of the Worldcup with Match) is: 
But whether you use Excel or Access to track the Worldcup, the conclusion could be that MS Office is a great software suite for doing this, and with this blog I wanted to show you another member of the Office family.

And there are also many smartphone apps for the Worldcup. One of them of course by FIFA, but after having seen this video about FIFA:

https://www.youtube.com/watch?v=DlJEt2KU33I

I decided to look for something else, and found this nice (Dutch) app:

http://m.apps.store.aptoide.com/app/market/nl.itnext.ec2012/31/5333597/World%20Cup%202014

And if you think Match could be something for your club, write me an email, with subject 'Request info Match'.


Note 8-6-2014:


During the WorldCup I'll update this blog with the results after every phase, and also include the Match_BE.MDB database file, so if you want to use Match to track the Worldcup, you can use this database.

And maybe I'll publish it also on my new own free TK-domain, from the (is)land of Tokelau :)   

http://www.eigersoftware.tk/


Figures simulation of WorldCup 2014 in Match:


fig.2: After phase 1 (qualifacions)


fig.3: After final 


Part 2 (after end Worldcup)

I use the match Spain - Netherlands (1-5 !) to show what match-data you can registrate in Match.


fig.4: Match details (teams, date,time, location, referee) and result


fig.5: goals

--
fig.6: yellow&red cards


fig.7: line-up and mark (for performance, 0-10).
NB: marks for Dutch players in this match I copied from:

--
And Match can generate a Word-report with all these data in this format:

** match #3:  Spain - Netherlands; 1 - 5 ** 

goals:  *T.27 Alonso X. (Spain) (PNL), *T.44 van Persie (Netherlands) ,  *T.53 Robben (Netherlands) ,  *T.64 de Vrij (Netherlands),   *T.72 van Persie (Netherlands),   *T.80 Robben (Netherlands)   


cards:  *T.25 de Guzman (Netherlands) yellow_card, *T.41 de Vrij (Netherlands) yellow_card, *T.65 Casillas (Spain) yellow_card, *T.66 van Persie (Netherlands) yellow_card 

lineup player_away:  Cillessen Vlaar de Vrij (*T.out: 77),  Martins Indi Blind, de Jong, Janmaat, de Guzman (*T.out: 62),  van Persie(C) (*T.out: 79),  Sneijder, Robben, Veltman (*T.in: 77),  Lens (*T.in: 79),  Wijnaldum (*T.in: 62) 


Details: location:Salvador , date: 13/06/2014 , referee: Rizzoli 


Besides this match-details which you can register in Match, on the FIFA-site you can find some more interesting statistics, see:


And to finish this part about the Spain - Netherlands match:  for the readers who might wonder what photos were published in the Dutch media after this match, I include this link (my favourite is photo #1, van Persie as a bullfighter):

http://comee-nl.tumblr.com/post/88703089661/de-mooiste-fotos-van-spanje-nederland-wk-2014


And to conclude this post, I´ll show some figures of reports generated by Match V2 (with all results Worldcup) (reports are included in par. Downloads):


fig.8: match-results per group 


fig.9:  All match results (from all phases)


fig.10: Ranking teams per group (end phase 1)


fig.11: End ranking teams


fig.12: Topscorer-list

NB: I only registered the goals made in the match Spain - Netherlands


Downloads :

V1: 

* Application: Match-installer:

http://goo.gl/5dzEiM

* Backup databases simulation of WorldCup 2014 in Match:

https://drive.google.com/file/d/0BywxxSJoaUYxZmc3VmlUdXF3MDg/edit?usp=sharing


V2:

* Backup databases results of WorldCup 2014 in Match:

https://drive.google.com/file/d/0BywxxSJoaUYxXzRhUjRxa1AxVmc/edit?usp=sharing

NB: to view a MDB-file with the Match-application, you must rename the file to: Match_v6_BE.mdb

* Reports results of WorldCup 2014 in Match:


28 May 2014

Excel with Match Schedule for 2014 FIFA World Cup Soccer Brazil

#17 Excel with Match Schedule for 2014 FIFA World Cup Soccer Brazil

For the upcoming Worldcup Soccer I made 3 Excels with the match-schedule, in 3 formats:
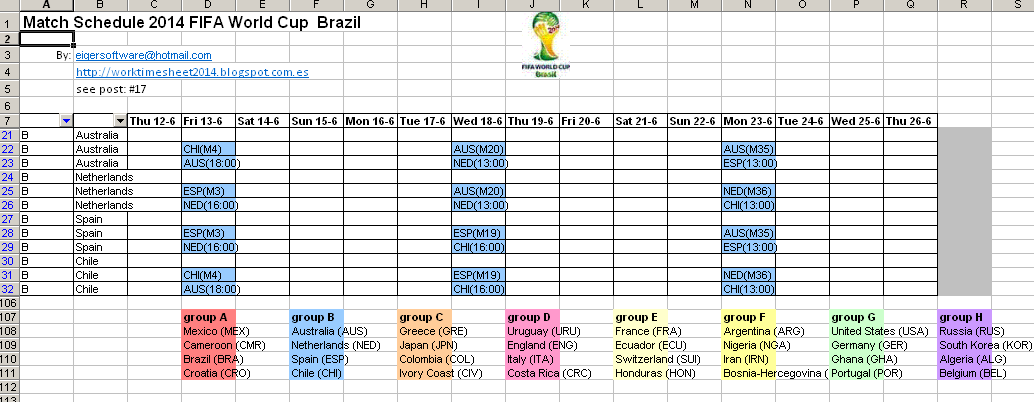
-1: Calendar (see fig.1)
-2: Table, with times of your timezone (see fig.2)
-3: Matrix (see fig.3).

To create these Excels, I used a database-program that I once made (with MS Acces 97...), Match, which I used since 2004 until now to track the UEFA and FIFA soccer championships.
In a next post I'll write more about Match, but if you already want to know something more about it, see this webite:

http://eigersoftware.tripod.com/match.htm

or for the Excel-reports that I created with Match for the UEFA and FIFA soccer championships from 2004 until now:

http://www.scribd.com/eigersoftware


The source for the Excel match-schedules is from the FIFA site:

http://resources.fifa.com/mm/document/tournament/competition/01/52/99/91/2014fwc_matchschedule_wgroups_22042014_en_neutral.pdf

which is in calendar-format (as in fig.1), and shows for every match this information:
- Match-ID
- Teams and 'virtual teams' for final-rounds (e.g. team A1 is winner (rank 1) of group A)
- Group (A-H)
- Date and time (in local (Brazilian) time
- City (stadium)


fig.1a: match schedule in Calendar format, with Location on y-axis


fig.1b: match schedule in Calendar format, with Group/Team on y-axis


fig.2: match schedule in Table format


fig.3: match schedule in Matrix format


Match schedule 1: Calendar format (see fig.1a, 1b)

Fig. 1a:
This schedule is like the schedule on the FIFA site. The only difference is the way I labeled the matches for the final-rounds, e.g.:
- match 49 on Sat.28-6, 1/8-finals, is in cells R13-R14, marked as 'M49', with 'virtual teams' A1 (winner group A) and B2 (runner-up group B)
- match 63 on Sat.12-7 (final for rank 3/4) is in cells AC16-AC17, marked as 'M63', with 'virtual teams' M62R2 (loser semi-final match 62) and M61R2 (loser semi-final match 61)
- match 64 on Sun.13-7 (final for rank 1/2) is in cells AD40-AD41, marked as 'M64', with 'virtual teams' M62R1 (winner semi-final match 62) and M61R1 (winner semi-final match 61)

On the y-axis, the 2 cities marked with '#' (Cuiaba and Manaus) have local time UTC-4, the rest has UTC-3.

Fig.1b:
In this calendar, the y-axis has data from the Group/Team-table in Match (in contrast with fig.1a, which had data from the Location-table). Besides, I put a filter on this column, which in fig.1b is applied to group B, so that the schedule only shows the matches for teams in this group, like the Netherlands and Spain (which were the finalist of the Worldcup in 2010...).

So the Calendar-report is like a pivot-table: In Match you can choose which data (Location or Group/Team) you want on the y-axis. On this website you can find another very nice example how you can present the match-schedule from different viewpoints (location, group, team, date):

http://www.marca.com/deporte/futbol/mundial/calendario/schedule.html

Note: I included this schedule only in Download-Mirror #1.


Match schedule 2: Table format (see fig.2)

Note: The flag-icons come from: 

The table in this report has 2 time-columns: 
-  the local (Brazilian) time, which is (for most cities) UTC-3 or (for 2 cities) UTC-4 (see above). 
- 'your' time, so the time in your time-zone, which is a parameter in the Excel, see cells F3-G3, where you can fill the 'offset' of your timezone in hours (F3) and minutes (G3) with respect to Greenwhich Mean Time (GMT/UTC), e.g.: for CEST (Central European Summer time, which is the time in summer for most European countries), you should fill: 2 (F3) and 0 (G3), which means: UTC + 02:00.

To find your UTC-time, see e.g. : 


So if you live in the CEST-time zone, the 1st match you can see at TV at  22:00 (12-6).

Besides this table, the Excel also has several pivot-tables, which were usefull for me to check if I entered the match-data correctly in my program Match. E.g.: table 2 in sheet 3 shows that in every group the number of matches is 6. Another pivot-table shows the number of matches per city.

And the map with the countries which participate in the Worldcup 2014 (on bottom of sheet) I made with Powermap, see my previous post:

http://worktimesheet2014.blogspot.com.es/2014/05/excel-2013-powermap-and-world-cup-soccer.html


Match schedule 3: Matrix format (see fig.3)

This schedule shows in a compact way for all the matches per group where and when they will be played.

Another (non-Excel) report with the match-schedule generated by Match you can see in fig.4.


fig.4: MS Acces report: match schedule per group


Note 30-5-2014:
The post for Match (my program which generated the Excels in this post) I just finished, see:


Downloads

#Download-Mirror 1 
NB: site has Excel Web-app, if you don't have Excel installed

Table-format:

Calendar-format:

Calendar with Location-view
Matrix-format:


#Download-Mirror 2
(Excels + PDF in 1 zip)


25 May 2014

Pool for betting 2014 World Cup Soccer in Brazil

#16  Pool for betting 2014 World Cup Soccer in Brazil

Note 29-7-2014:
I used this Excel (version 2) for an office-pool, which some small changes. I updated this post to show the results of the office-pool, and also included the final Excel v2 in par. Downloads. I refer to this Excel with V2 and to the original Excel with V1. 

For big sports events like the upcoming 2014 FIFA Worldcup Soccer in Brazil, a lot of people organize with friends or collegues at work a pool to bet who will win the cup. In this post I'll show you how you can do this with Excel, see fig.0 for the end-result (V2)


fig.0: Input office-pool V2


In the table below you can see what you (a gambler) must predict and how many points you can win for each prediction.

Table 1a: Point-system Pool in V1.

V2:
Table 1b: Point-system Pool in V2.

V1:
Points #2 are only calculated when there are more than 1 gamblers with max. points (4), so to tiebreak. The Excel-files with name '*test_Round*' are the result of little demo I made to show how this system calculates the points for 8 gamblers with 8 different predictions, ranging from nothing correct (so 0 points for finalist 1 and 2) to everything correct (finalist 1, 2 winner final and goals winner and loser final all correct). See fig.1 for the end-result of this simulation (row 48, 'Total Points').

V2:
In stead of the finalists (rank 1 and 2) you have to predict which teams end in the top 4 (rank 1-4), and tie-breaking is not the result of the final (goals) but the topscorer of the tournament and his country (so in case no one has predicted the correct topscorer, we look at the country of the top-scorer). In V2 the posibilty of a draw (gamblers with same amount of points) is smaller (that is: the posiblity there is only 1 winner (and not more than 1) is higher). As in V1, a binary point system is used, so that a gambler who predicted correctly e.g. team with rank 1 (16 points) wins from another gambler who predicted correctly the teams with rank 2,3 and 4, but not team with rank 1 (8+4+2=14 points).
In V2, phase 2 is to tie-break in case there are more than 1 gamblers with the same amount of points (no necesary the max. amount of points like in V1)


Fig.1: simulation WorldCup-pool with 8 gamblers, with result after final

Suppose after the Group-round (1), it appears nobody has predicted any of the teams who go to the next round (2) (1/8 finals) correctly (or in other words: all the teams which the gamblers predicted as finalists are eliminitad after round 1), you could say the game is over. But in stead, you could also give everybody a new possibility, so every gambler could give his new predictions (before the start of round 2).

How to use this Excel?
The idea is that it is used by 2 types of users:
- gamblers, who fill in their predictions
-administrator, who checks the gamblers input, and updates the Excel after every round with the results.
NB: WorldCup has 1 Group/Qualification-round and 4 final-rounds: 1/8 finals,  1/4 finals, 1/2 finals, final. (I exclude the match for place/rank 3-4, because for this pool it is not relevant).

How can they do this in the Excel:

* Gambler:
He must fill a '1' and '2' in his column (F7:F38 for gambler G1) on the row of the team he predicts will play the final and win (rank 1) or lose (rank2) and also his predicton of the result of the final (F40: goals winner, F41: goals loser)

* Admin:

- After gamblers completed their input:
Admin. Must check if on row 39 and 41 in the columns with the gambler-input (right to the word 'CHECK') there are no red-cells, only green cells (sum of forecast of teams with rank 1 and 2 must be 3).

- Before every round:
 Admin must fill in cel C3 round-nr: 32 (Group-Qualifications), 16 (1/8 finals), 8 (1/4 finals), 4 (1/2 finals), 2 (final). This round-number should be copied also into column (C7:C38) for each team which is still in the competition and for each eliminated team he should fill a '0'. The total number of teams which are still in the competition you can see in C4, which must be the same as cell C3, round-nr. And if there is a difference (between C3 and C4), you can see it in cell E4 (red if error, green if OK).
In the demo-files (name *test*), I copied the result of every round in a file which name ends with a number which indicates who many teams are in that round, so for the Group-round (with 32 teams), that is 32, for round 2 (1/8 finals) that is 16 ('best of 16) (see fig.2) etc.

- For final:
 Admin. must fill a '1' and '2' in column D7:D38 on the row of the team which will play the final and win (rank 1) or lose (rank2) and also the result of the final (D40: goals winner, D41: goals loser).

Cells where user must input a value (column D for admin, columns F, G etc. for gambler G1, G2 etc) have these data-validations:

- F7: Forecast result, check: allowed values: 1, 2 (for rank 1 and 2, winner and loser of final)

- F39: total forecast result rank 1 and 2 must be 3, manual check (conditional formatting: red = error, green = OK)

- F41: Goals loser, check: Goals loser < Goals winner (F40) (value between 0 and =F40-1)

fig.2: competition in round 2 (1/8 finals, 'best of 16') in simulation V1

In the demo/simulation you can e.g. see:
- Gambler G1 forecasted MEX and CMR are the finalists (cells F7,F8) with rank 1 (winner) and 2 (loser) and with result MEX-CMR: 1-0 (cell F40, F41 in see fig.1)
- Gambler G2 has after round 1 has been played (so at the start of round 2 (1/8 finals) only 1 team which is still in the competition (cell G45 is orange): his forecast for rank 1 and 2 where ESP and FRA, and after round 1, FRA has been eliminitad (cell C23 has value 0) and ESP is in the next round (best of 16) (cell C13 has value 16), see fig.2.
- After the final has been played, gambler G1 had none of its 2 teams which he predicted as finalist correct (cell F45 is red), see fig.1
- After the final has been played, there were 4 gamblers with the maximum number of points (4): G5, G6, G7, G8, and G8 is the winner after the tiebreak, with 7 points, see cell M48 fig.1

The Excel has also a statistic (graphic): Total of betts for rank 1 (winner final) and rank 2 (loser final) per team, see fig.3.

fig.3: Statistics betts in simulation V1

Well, I hope it is clear how this Excel works and that you can use it for your World-Cup pool.


Note 29-7-2014: Results my office-pool:
In the office-pool, there were 12 participants. In fig.4 you can see their predictions for the 32 teams (before start worldcup) and in fig.5 the end-result for the top 4 teams. As you can see, there was only 1 gambler who predicted that the Netherlands would end in the top 4 and it wasn´t me.. but SER7, who in the end also won the pool.


fig.4: predictions before start in V2

fig.5: predictions after end in V2


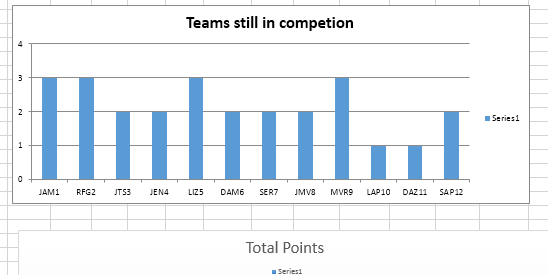
After every phase of the worldcup, I updated column C with 0 o N (16, 8, 4,..) if a team did or did no pass to the next round, and a graphic showed how many teams of each gambler´s prediction were still in the competition (not eliminated), see fig. 6 for result at the end of the worldcup.


fig.6: total teams still in competition at end worldcup (so who ended in top 4)


And the end-result (total points per gambler) was:

fig.7: total points per gambler

As you can see, there were 3 potential winners, so gamblers with the same amount of points (17 of 32) (all 3 had predicted Germany as winner and 1 other team in top 4 although not with the correct rank), also after the tie-break (none of them had the topscorer or his country correct), so we decided to add 1 extra rule: the winner is the one whose prediction of the topscorer is the one with the highest number of goals, and that made SER7 the final winner, which in my opinion he deserved because as I said before, he was the only one who predicted that the Netherlands would end in the top 4.

How to win next time the office-pool for the Worldcup?

*1: Know your ´classics´:
Football is a simple game. Twenty-two men chase a ball for 90 minutes and at the end, the Germans always win. - Gary Lineker

see:
http://www.brainyquote.com/quotes/quotes/g/garylineke422219.html

*2: Get a Windows smartphone:
It´s voice-assistent Cortana predicted 15 of the 16 teams in the elimination-phases (1/8 final until final) correctly, using Big Data techniques (e.g. using dat from prediction-markets), so it is the sucesor of octopus Paul of the 2010 Worldup. See:

http://www.maximumpc.com/microsofts_cortana_voice_assistant_correctly_predicts_world_cup_winner150

*3: Use a more scientific approach, e.g. use game-theory, see e.g. :

http://www.minyanville.com/special-features/sports-business/articles/march-madness-final-four-game-theory/2/27/2012/id/39600


Downloads

#Mirror 1: 

V1: 1 file (without demo)

11 May 2014

Excel 2013, PowerMap and World Cup Soccer

#15  Excel 2013, PowerMap and 2014 World Cup Soccer 

NB: This post has 2 Excel-files (embedded in 1 zip), see ‘Downloads’ at bottom of page. To be able to open these files, you must have Excel 2013 with the Power-BI add-ins installed.


With the 2014 FIFA Worldcup coming closer, I thought it might be interesting to use this event to show the Excel add-in PowerMap,  a component of the Power-BI suite for Excel 2013 which I didn´t show yet in my previous post about Excel and Business Intelligence (BI), see:

http://worktimesheet2014.blogspot.com.es/2014/05/excel-2013-and-business-intelligence.html

As I explained in part 2 of that post, in Excel 2013 you can use PowerView to visualize geospatial data in a map. But with PowerMap you can do much more then that, as you´ll see in this post.

PART 1:

Excel: WorldCupHistory.xlsx

First a little bit of history of the World Cup Soccer. In this Excel, you can see which teams reached the top four (how often did the team end at position 1 to 4) and their final ranking in the tournament (so 1 to 4), for which I used PowerQuery with option 'select from Web', to import the table with this data from:

http://en.wikipedia.org/wiki/FIFA_World_Cup

Then I edited this table a bit, to end up with the table in PowerPivot as you can see in fig.1  (note the column 'Continent' has corresponding datacategory).

fig.1 table in PowerPivot


Then I created in a new sheet in Excel a PowerView report with a map and the winners of all World Cups (so the ones who got the title 'World Campion'), and how often they won, which determines the size of the dot on the map, see fig.2. Note that in Filter 'Titles' value '0' is un-checked (and values '1' to '5' checked), so that the 2 elements in the report (map and table) only show countries which have won 1 or more times the World Cup.

fig.2: PowerView with map

And the last step was to create a simular report with PowerMap, see fig.3.
fig.3: PowerMap

For this report, I chose the options 'Globe (there is also a 'flat-map' variant, see part 2 of this post) and 'bar-charts' (other options are 'dots' or 'regions', see part 2). As you can see in the bottom-left corner, the Bing-Map is used for this, so you must be connected to the web.
NB: the PowerMap-report is stored in Excel in sheet-3, although you don´t directly see it. First, you must activate the COM-addin for PowerMap, see menu File > Options), and then in sheet-3 you must click in menu Insert > PowerMap, and then apears the 'tour' which I created). PowerMap is still in 'preview-version', I suppose Microsoft solves this before the final release.


PART 2:

Excel: WorldCup2014Countries.xlsx

This Excel has a table with the 32 countries which qualified for the 2014 World Cup in Brazil, see e.g.:

http://prosoccertalk.nbcsports.com/2013/11/20/2014-fifa-world-cup-countries-qualified-for-teams-draw-date/

Note that this table is what they call in BI-terms a 'factless fact-table', that is: it has only dimension-columns (type char) and no measures (type number). I could have added a dummy-measure 'counter' which always has value '1', but it is not necessary.
In fig.4 and 5 you can see the reports in PowerView and PowerMap, the last one with options 'Region' (to color the 32 countries) and 'flat map', and if you change this to 'Globe', it shows a nice animated transition from Map to Globe.

fig.4: PowerView

fig.5: PowerMap


For more information about PowerMap, see e.g.:

http://www.databasejournal.com/sqletc/getting-started-with-microsoft-power-map-for-excel.html


Downloads

https://drive.google.com/file/d/0BywxxSJoaUYxdF9HYVAtZ3pLcWs/edit?usp=sharing