Showing posts with label Messi. Show all posts

18 Sept 2023

Messi / Inter Miami / Major League Soccer - Power BI dashboard

#87 Messi / Inter Miami / Major League Soccer - Power BI dashboard 

Now Messi went to the USA to play for Inter Miami in the Major League Soccer (MLS), I wanted to know more about this club and competition and decided to make Power BI dashboard for it, after having updated my Looker/Google Data Studio dashboard 'Messi Goal Tracker' to include his goals for Inter Miami (see this post)

I googled on MLS and API and found this nice API website:

https://sportsdata.io/developers

from which you can get data for free for a big part, although some data is scrambled and only available if you pay)

With the data of some of the API-endpoints of this site I was able to create this dashboard:


In this pic you can see 2 pages of the dashboard:

-1: the competitions Inter Miami plays in, so beside MLS also the League Cup (international competition with besides clubs from the USA also clubs from Mexico and Canada)

-2: bubble-chart with total number of US-clubs in MLS per US-state.

And here some pics of other pages in the dashboard:

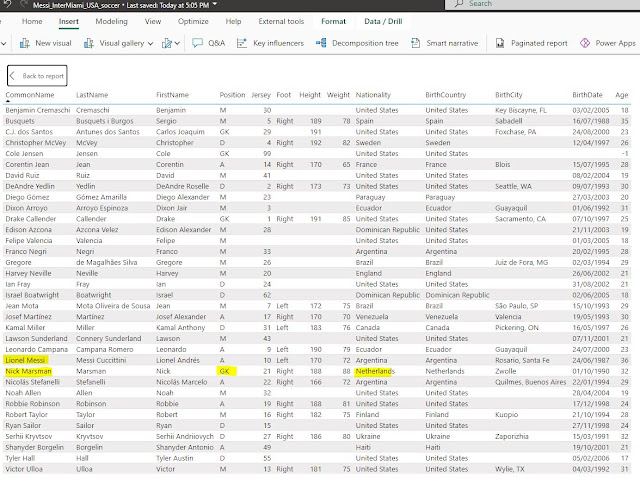
This ArcGIS filled map shows the number of players from Inter Miami that come from that country  (lighter color in map means higher value), which shows e.g. that there is one Dutch player, Nick Marsman (played before for Feyenoord), although this info looks to be outdated (Marsman already left Miami). And with a right-click on a country, you activate the drill-through feature that leads you to another page of the report, with player-info, that is pre-filtered with the country that you selected.

And here the full details of the MLS-teams and of the Inter Miami-players:


Some more details about the datasource of this dashboard, so the Sportsdata.io soccer API-endpoints:

https://sportsdata.io/developers/api-documentation/soccer

 https://sportsdata.io/developers/api-documentation/soccer#/endpoint/competition-fixtures-league-details


The API-endpoints I needed, I stored it API-tool Postman.
NB: for a Postman-tutorial, see e.g. this video

And this API-call information I then copied from Postman to Power BI, in datasources of type 'Web', including the parameters of the API-call, e.g. team Inter Miami = 2363:

NB:

For some more details on how to work with parameters in Power BI / Power Query, see e.g.:

https://learn.microsoft.com/en-us/power-query/power-query-query-parameters

https://msdynamicsworld.com/story/use-parameters-and-custom-functions-call-apis-power-bi


Messi shows he is still in a good shape, see e.g. his first goal for Inter Miami, and David Beckham's reaction:

https://www.cbssports.com/soccer/news/lionel-messi-scores-dramatic-94th-minute-winner-in-inter-miami-debut-against-cruz-azul-in-leagues-cup/live/

https://www.tiktok.com/@_forca_barca/video/7258589957751655682

Here's the API-output (json-format) for that goal:


MLS soccer will be happy that Messi has chosen for the US to finish his career as earlier other soccer legends did, as Cruyff, Pele, Beckenbaur and more recently, Beckham, see:

https://en.prothomalo.com/sports/football/38nc6f2jmd


Embedded Power BI dashboard

 NB: I also published it on the Power BI Data Stories Gallery:

Messi / Inter Miami / Major League Soccer - Power ... - Microsoft Fabric Community


Download  

Power BI Dashboard


5 Jan 2021

Messi Goal Tracker dashboard in Google Data Studio

  #73: Messi Goal Tracker dashboard in Google Data Studio

 
Update 11/9/2023
 
Begin Update
 
Because of Messi's transfer to Inter Miami I had to update my Messi-goal-tracker GoogleDataStudio-report to include the goals that he made for his new club.
And I included another page to see easily the #goals he made per club and competition.


End Update 11/9/2023
 
  
Update 3/10/2021:
 
Begin Update
Now Messi moved to Paris Saint-Germain (PSG), I had to change my Messi-goal-tracker GoogleDataStudio-report a bit, to reflect e.g. if a goal he scored in the Champions League was a goal for FC Barcelona or for PSG.

I below screenshot you can see how the new dashboard looks like:


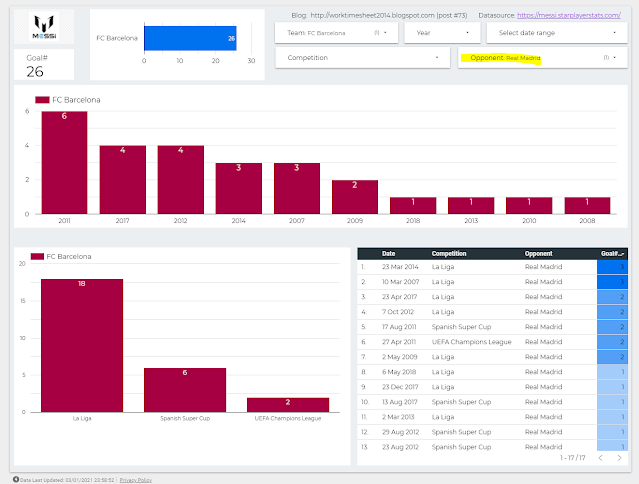
I leave it to you to find the differences/improvements with the previous version of the dashboard (see FIG.1 below) ;) But screenshot below, which has a filter on opponent Manchester City, against which Messi made hist 1st goal for PSG this week, could help you.


End Update
 
When Messi made on 22/12/2020 his 644-th goal for FC Barcelona, he broke the 46 year old record '# goals made for one club' of Pele (who made 643 goals for Santos). See e.g.:
https://www.espn.in/football/barcelona/story/4215713/barcelonas-messi-overtakes-peles-scoring-record-with-644-goals-for-the-club

or (in Spanish, with a chart with a breakdown of the 644 goals by competiton):
https://www.mundodeportivo.com/futbol/fc-barcelona/20201223/491248765482/barca-valladolid.html

This new record of Messi inspired me to make a new Messi-dashboard.
The previous Messi-dashboards I made, for his record '# goals made in one year' 
(91 goals in 2012), see posts:

https://worktimesheet2014.blogspot.com/2015/08/dashboard-for-messis-worldrecord-of-91.html 

https://worktimesheet2014.blogspot.com/2016/12/powerbi-dashboard-for-messis.html

https://worktimesheet2014.blogspot.com/2020/01/google-data-studio-dashboard-for-messi.html

were 'static snapshots'.  This time I wanted to make a 'live-dashboard', so one that is automatically updated after each match of Messi in which he scored. So that when Messi retires in Barcelona (or leaves to another club, which might happen at the end of this season (2020-2021)..), this dashboard shows his final score (so which will probably be more than the current 644 goals).
In FIG.1 you can see my dashboard, and for the dashboard in Google Data Studio, see: https://datastudio.google.com/s/lZaGsxWsomc
And at the bottom of this post there is also an embedded version of the dashboard.


FIG.1: Messi (live) dashboard, showing his record '644-goals for one club' (Barca).


Datasource

I found this Power BI Messi-dashboard of Microsoft Data Platform MVP Tristan Malherbe:
https://community.powerbi.com/t5/Data-Stories-Gallery/Incredible-Lionel-Messi/td-p/82225 that uses this (live) datasource: https://messi.starplayerstats.com/en ,
which is made by Dutch sports journalist Ramon Min.
So I decided to use this datasource as well. 
I used Google Sheets to import this data, using this function:

=IMPORTHTML("https://messi.starplayerstats.com/en/goals/0/0/all/0/0/0/t/all/all/0/0/1","table",1)

see also FIG.2


https://docs.google.com/spreadsheets/d/13Z81oKYbcyXSiETIEd_HT-L7_pzJfL7YjKC_ISyrhD8/edit?usp=sharing

FIG.2: G-Sheets with import of data of Messi-stats website

For this spreadsheet, the settings for (re)calculation are 'on change and after every hour', so once R. Min has updated his website (which he does after every Messi-match), in max. 1 hour my G-Sheet is also updated.
See also:
https://webapps.stackexchange.com/questions/6776/what-are-the-refresh-characteristics-of-the-google-spreadsheet-import-functions

Dashboard

I made the dashboard in Google Data Studio (GDS). To make the source-data better for reporting, I created some extra fields, e.g. 'Competition', that for international competitions (so where Messi plays for Argentina) aggregates all goals for one 'competition-type'. So instead of having the goals of Messi in World Cup seperate by year/edition (as the datasource has), using field 'Competition' in my dashboard you get the sum of all World Cup goals that Messi made.
For the datamodel of the dashboard and the formula used for field 'Competiton', see FIG.3-4

FIG.2: datamodel of dashboard


FIG.3: formula for field 'Competition' of datamodel 

I wanted to keep my dashboard simple, so with just the basic data: 
- dimensions: date, competition (-> team for which Messi played), opponent
- fact: #goals
So more detailed (dimension-)data of how Messi scored (penalti, left-foot etc.) I left out of the dashboard. 

I chose to set report-setting 'enable viewer filters in report link' to 'true', so that it is possible to make a snapshot of the dashboard for a certain filter-value, broke a record, see e.g. FIG.4.


FIG.4: Messi's 2012-record: '#goals in 1 year', so with report-filter: Year = 2012
https://datastudio.google.com/s/ji-MWIO5TuI
or:
https://datastudio.google.com/u/1/reporting/9d51c83b-11ea-44eb-b4dd-20a8ca54fd8a/page/JS6uB?params=%7B%22df7%22:%22include%25EE%2580%25801%25EE%2580%2580IN%25EE%2580%25802012%22%7D

For the bar-charts, I set the colors for Messi's teams (Barca and Argentina) according to the shirt-colors of these teams, see e.g.: https://www.schemecolor.com/fc-barcelona.php

The data in the charts are sorted by metric ('Goal#', in descending order), but you can change this in e.g. sort by dimension 'Year'.

The dashboard is interactive (e.g. it has filters and all charts are connected so that if you filter in one of them, the others get filtered as well), so you can explore the data. For some of my own explorations, see below figures.


FIG.5: matches in Messi's top-year 2012 in which he made 3 or more goals
NB: note that Messi made against Bayer Leverkussen 5 goals, the first player ever to do this in a Champions League match,  see: https://youtu.be/HtMU0x1L4EU


FIG.6: Goals made in Champions League


FIG.7: Goals made against Real Madrid


To celebrate this new record of Messi, his sponser Budweiser sent to the 160 goalkeepers of the teams against which Messi scored his 644 goals, special 'Messi-beer', see e.g:

https://www.givemesport.com/1631804-lionel-messi-which-goalkeepers-got-the-644-bottles-of-budweiser-beer

https://www.thedrum.com/news/2020/12/30/budweiser-bestows-beer-upon-each-the-160-goal-keepers-lionel-messi-scored#:~:text=Today%2C%20we're%20talking%20about,these%20goals%20%E2%80%93%20some%20120%20keepers.

If you liked this post and want to buy me a Budweiser, click on the PayPal-Donate button on the top-right of this post ;)

Cheers and best wishes for 2021.


References

https://messi.com/en/estadisticas-barcelona/

https://www.transfermarkt.com/lionel-messi/alletore/spieler/28003

https://www.theguardian.com/football/2021/jan/01/pele-revolutionary-status-must-survive-numbers-game-against-lionel-messi-santos

https://medium.com/totalfootball/why-pele-remains-the-greatest-footballer-of-all-time-1fc00bea0120

https://www.90min.com/posts/3062276-forget-pele-maradona-messi-and-ronaldo-johan-cruyff-has-to-be-greatest-of-all-time


Downloads

PDF of dashboard


Embedded Dashboard

<iframe width="600" height="450" src="https://datastudio.google.com/embed/reporting/9d51c83b-11ea-44eb-b4dd-20a8ca54fd8a/page/JS6uB" frameborder="0" style="border:0" allowfullscreen></iframe>


18 Jan 2020

Google Data Studio Dashboard for Messi, my blog and my Youtube videos

#65 Google Data Studio (GDS) Dashboard for Messi-goals, my blog and my Youtube videos

4/1/2021:
Today I made a new live Messi Goal Tracker dashboard, see:
https://worktimesheet2014.blogspot.com/2021/01/messi-goal-tracker-dashboard-in-google.html

4/4/2020:
Today I made my Messi-dataset (CSV-file with raw-data, that I used for my dashboard) available as 'open data' on Github, see:
https://github.com/mvanreek/Sports_data


Although this blog is mainly about Microsoft Office's Excel, for this post I took a look at
Google's G Suit ("Google Docs"), especially Google Sheets (a spreadsheet-tool like MS Exel) and Google Data Studio (GDS) (a BI/dataviz. tool like MS Power BI).
For more info about these Google products and a comparison with the 'equivalent' Microsoft products, see Literature below. Most important thing to know is that with GDS, Google wants to make Analytics accesible for anyone, not just for big companies with time, money and (tech) skills.

To test GDS, I first used the 'Messi-dataset' that I used to create dashboards in Excel+Powerview and Power BI for previous blog-posts, see:
http://worktimesheet2014.blogspot.com/2016/12/powerbi-dashboard-for-messis.html
http://worktimesheet2014.blogspot.com/2015/08/dashboard-for-messis-worldrecord-of-91.html

The 'Messi-dataset' was in Excel, and I converted it to Google Sheets (see Downloads below), and in GDS, I connected to this G-Sheets datasource.
For the GDS-report (see fig.1), I used the Excel + Power BI reports I made before as an example, but I made some changes to improve the 'story-telling' by the report, to give insight in how Messi made these goals (the 'mode', e.g. left-foot), where (in which team) and when. This lead to the following charts in the report:
- score-card with total goals
- stacked bar-charts for # goals by Team/Competition
- bar-charts for # goals by Mode
- stacked column-chart for # goals by Time/Competition

fig.1: Google Data Studio Report with Messi goals

https://datastudio.google.com/reporting/39453d65-7507-4819-aeea-b3603d227645


Embedded Youtube-video of maybe Messi's best goal:
https://www.youtube.com/watch?v=WkqecpHcIPw

GDS can connect to various datasources, and I tried 2 others:

-1: Google Analytics (for my blog), see fig.2 for the report. In this report I set the chart-property 'interactivity - filter' to 'on' for all charts, so that if you filter in one chart, this filter is applied to the other charts (see fig.2c, filter: Year = 2019). I also enabled the 'drill-down' option for the Geography and Time dimensions (see fig.2b-c, Continent = Europe).
For a look at the Google Analytics dataset (with facts/meassures and dimensions), see fig.2d.

NB: Google Analytics is also loaded with standard reports, see fig.3, which is good for getting insights for e.g. a business analyst, but if he wants to share these insights with others (e.g. management) in a presentation, he could use GDS to create a nicer report.

-2: Youtube Analytics  (for my YT-channel / some video's I uploaded once), see fig.4.


fig.2a: Google Analytics for my blog - page 1

https://datastudio.google.com/reporting/09d957cc-9cb3-4611-b8ae-37ec5a8af90c


fig.2b: Google Analytics for my blog - page 2: without filters


fig.2c: Google Analytics for my blog - page 2:  with filter on Year and drilldown (Continent > Country)


fig.2d: Google Analytics dataset


fig.3: Google Analytics standard dashboard for my blog


fig.4: Youtube Analytics  (for my YT-channel)

https://datastudio.google.com/reporting/14ca88f6-548d-4cf6-bfc5-ee662f29a4a4


I think with Google Data Studio it is possible to make really nice reports in an easy way, and the fact that is free, easy to share (just like any Google Docs file) and a 100% cloud solution makes GDS a very interesting option for your BI/dataviz.work. And even more so if your company is using Google G Suite, which happens to be the case in the company I work for (#Visma|Raet , part of #Visma)..


Literature

[1]
Google Data Studio: Pricing & In-depth Reviews

[2]
Google Data studio, a killjoy for Microsoft Power BI

[3]
I Evaluated 4 BI Tools: Power BI, Tableau, Google Data Studio, & Sisense. Here's What I Found


Downloads

Mirror #1

Messi-dataset (G-Sheets):
https://docs.google.com/spreadsheets/d/1ldQAt_EV9MqjNdpMDqIa6uzzkFDqPlTlVhM1NqqdKoM/edit#gid=0

Messi GDS-report + PDF:
https://datastudio.google.com/reporting/39453d65-7507-4819-aeea-b3603d227645
https://drive.google.com/open?id=1Lhb0CNO685Bl-zoCGlEdjK0IwH890Wc4


9 Dec 2016

PowerBI Dashboard for Messi´s worldrecord of 91 goals in one year


#58 PowerBI Dashboard for Messi´s worldrecord of 91 goals in one year

4/1/2021:
Today I made a new live Messi Goal Tracker dashboard, see:


NB: 
- This post is not about an Excel I made (but about a Microsoft Power BI dashboard I made, which is (almost) a copy of an Excel workbook I blogged about earlier), so I tagged it with the 'More' category.

Once I made an Excel with a PowerView dashboard for Messi's worldrecord of #goals in one year (91), see:

http://worktimesheet2014.blogspot.com.es/2015/08/dashboard-for-messis-worldrecord-of-91.html

In this post, I made a new version of this dashboard, but now in Microsoft PowerBI, and also with some improvements, e.g. the treemap-view for all matches in which Messi scored, aggregated by the team and competition where he made his goals. NB: For more info about the Treemap-chart, see my previous post:

http://worktimesheet2014.blogspot.com/2016/07/treemap-and-sunburst-excel2016-charts.html

See fig.1 for the end-result, in PowerBI Desktop.


Fig.1 Messi-Dashboard in PowerBI Desktop

The nice thing of PowerBI-dashboards is that they are suited for any device, so apart from PC also smartphone or tablet, see fig.2, in PowerBI-online (cloud-service), so this is a site for sharing your dashboards, for mine, see:

https://app.powerbi.com/view?r=eyJrIjoiOWYxMTVkNTUtZjJjMy00NTcyLWJlMzctNmNlYzE5ZmQyYjM1IiwidCI6ImI3OWIyMzE3LTM0ZGQtNDNlNS05MWEyLWNkNjZkM2FlMWYwYiIsImMiOjh9

This URL Power BI gave me after choosing menu-option: "File > Publish to web", which should make the dashboard 'public', see:
https://michielquakernaat.com/2016/02/03/want-to-share-your-power-bi-report-to-the-world-yes-we-can/

Or you can use this URL: https://app.powerbi.com/groups/me/dashboards/729276ac-365c-4473-9d42-1969ddd16dac

There is also a Power BI Community page which has a 'Data Stories Gallery', and I posted my 'Messi-dashboard' here:
http://community.powerbi.com/t5/Data-Stories-Gallery/Messi-s-worldrecord-of-total-goals-in-1-year-91-goals-in-2012/m-p/100642#M485

And here I found another nice Messi-dashboard:
http://community.powerbi.com/t5/Data-Stories-Gallery/Incredible-Lionel-Messi/m-p/82225/highlight/false#M386

So this is similar to this page of the Tableau-community:
https://public.tableau.com/en-us/s/gallery


Fig.2: Messi-Dashboard in PowerBI (online) on PC and smartphone


2 Nice build-in features of Power BI are:
- Quick Insight in the dataset (source of dashboard), which generates several 'data-profile' charts, see fig.2b
- Natural language Q&A, user types his question (in English), using some 'keywords' like 'by' to specify the 'slice-and-dice' dimensions, and Power BI answers (with charts) , see fig.2c.

For more details about these features (and Power BI in general), see:
http://www.computerworld.com/article/3088958/data-analytics/free-data-visualization-with-microsoft-power-bi-your-step-by-step-guide-with-video.html


Fig.2b: Quick Insight


Fig.2c: Natural language Q&A

As said in my previous blog-post, my Messi-dashboard was inspired by one made with BI/Dashboard-tool Tableau  (for which PowerBI was Microsofts answer/alternative), see fig.3 for the this version.


Fig.3: original Messi-dashboard in (free trial version of ) Tableau

To see another really nice example of a PowerBI-report with the results of the Spanish soccer League made by a friend, see fig.4 and his site: http://Ligasantanderbi.azurewebsites.net


Fig.4: PowerBI (with Azure) example with results Spanish soccer League

So with Power BI you can make really nice dashboards, and with the frequent updates/releases of Power BI, much more frequent than that of MS Office (Excel), one could wonder if for 'self-service BI' Power BI is the way to go (and not Excel with its 'Power-plugins' like Power View, Power Map etc.) Some say it is, see e.g.:

http://www.cio.com/article/2979725/enterprise-software/why-power-bi-is-the-future-of-excel.html

while others say you can/should use the 'pack' 'Power BI + Exel', see:
https://www.youtube.com/watch?v=jmTedSuKers

And what do you think? Comments are welcome (but please not anonymously, because I get a lot of 'fake' comments (publicity) from anonymous users, so I don't read anonymous comments.

Note 12/12/2016:
Although I haven't got any comments on this post (yet), apparently the 'editor' of The #PowerBI Daily (on www.paper.li), liked this post, because he published it here today, see fig.5.
NB: Paper.li is a site to create your own (virtual) newspaper of tweets of persons you follow, for more info, see:
http://www.takeflyte.com/flyte/2010/12/what-is-paper-li-a-newspaper-of-tweets.html

Fig.5: Blog-post referenced on  The #PowerBI Daily (on www.paper.li) 


References

-1: Good explanation of what is "Business Intelligence (BI): Multidimensional Analysis"
https://youtu.be/IhFkNmVmwn4

-2: A 'BI-solution' actually consists of 2 components: a Data Warehouse (DW), the (invisible) back-room ('the database') and BI, the (visual) front-room (the dashboard), where DW is normally about 80% of the solution, and BI 20 %, so it is the top of the ice-berg, as described here:
https://www.datamart.de/competence/business-intelligence-data-warehouse/Seiten/default.aspx


Downloads
Pbix-file, so PowerBI-report:

https://goo.gl/Ex4XbB


17 Aug 2015

Dashboard for Messi´s worldrecord of 91 goals in one year with Excel + PowerView

#41 Dashboard for Messi´s worldrecord of 91 goals in one year with Excel + PowerView

4/1/2021:
Today I made a new live Messi Goal Tracker dashboard, see:

Note 9/12/2016: 
See for a new version (with also new charts) made with Power BI, my new post: 
http://worktimesheet2014.blogspot.com/2016/12/powerbi-dashboard-for-messis.html


Next week starts the Spanish soccer League and I thought that it would be a nice moment to make a Excel PowerView dashboard for the best player of Barcelona (and the world and of all times), Lionel (Leo) Messi, based on this dashboard I once saw:

http://tblsft.com/public/gallery/messi039s-86-goals

or:

http://canchallena.lanacion.com.ar/1535469-gerd-muller-rompio-el-silencio-espero-que-su-record-dure-otros-40-anos

This dashboard was made with BI-tool Tableau, at the moment that Messi broke Gerd Mueller's 40-year record "most goals scored by a single player in a calendar year", on 9/12/2012, which was until then 85 goals, see:

http://www.guinnessworldrecords.com/news/2012/12/barcelona-star-lionel-messi-sets-new-goalscoring-record-46285/

For my Excel-dashboard I used the Tableau data-set and added 5 records for the goals Messi scored in the rest of Dec. 2012, so Messi´s world-record is 91 goals (made with Barcelona and Argentina ('Seleccion'). Actually I made 2 versions of the dashboard:

v1: report has summary-data (e.g. total goals per competition) and detail-data (match-details like date, opponent-team etc) (see fig.1b)

v2: report only has summary-data, no detail-data (see fig.1a)

As always, the download-URL´s for these Excel files can be found at the bottom of the blog-post.


            fig.1a PowerView report-v2 in PDF (exported from Excel) with Messi´s world record


           fig.1b PowerView report-v1 in PDF (exported from Excel) with Messi´s world record


To make this dashboard in Exel I used PowerView,  a (free) add-in for Excel 2013 Pro Plus, a Business Intelligence (BI)-tool for ad-hoc reporting. I copied the (Spanish) data-set with all Messi´s goals in 2012  from the Tableau-doc. to a worksheet  in Excel (and I added English comments to the Spanish column-headers), see fig.2


     fig.2: data-table with all Messi´s goals in 2012 (in pic. filtered for 1 opponent-team)

 Then I added this data to the datamodel in PowerPivot, another Excel add-in to perform data analysis using e.g. DAX-formulas like this:

Suma de Goles:=SUM([Goles])

, see fig.3 (formula-bar).


      fig.3: datamodel in PowerPivot, with DAX-formula


For sorting the goals by month ('Mes') in 'time-order' (so not in alphabetic-order), I added in the datamodel a column 'MesId' (1= Jan., 2= Feb etc), and used this DAX-formulas:

mes: =FORMAT([Fecha2];"MMM")

mesdID =MONTH([Fecha2])


see fig.4

        fig.4: datamodel with calculated field for month and month-ID, for sorting in report.

Once created the data-model in Power Pivot, I  opened Power View and created the elements in the report, which are (from top to bottom, left to right):

Report-V1:
  1. pie-chart: goals per score-mode (left-foot, penalty etc)
  2. stacked bar-chart: goals per month and score-mode
  3. tile (filter): goals per team
  4. total goals, 'Suma de Goles', calculated field from the datamodel
  5. total matches, calculated field from the datamodel with DAX-formula: Total Matches:=DISTINCTCOUNT([Fecha]) (fecha = 'date'). NB: field´s value is # matches in which Messi scored = 46, so not all matches which Messi played in 2012 = 69.
  6. slicer (filter): competitions
  7. pivot-table, goals per match (with match-details like date, score-mode etc)
So in report-v1 you can see the 3 ways in which you can filter data in PowerView: in the Filter-View pane (to the right of the report-canvas), with a Slicer or with Tiles.


Report-V2:
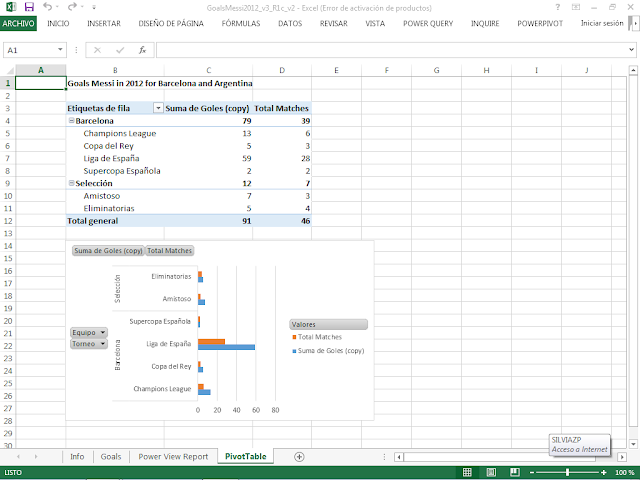
 as V1, except for bottom report, which contains a table in matrix-format and chart with goals per team and competition. NB: this matrix is like a pivot-table in Excel, see fig.5.

     fig.5: Pivot-table and chart : goals per team and competition

Creating the report-elements is just a matter of dragging and dropping the columns of the datamodel on the report-canvas and selecting the 'presentation-mode', e.g. Table or Chart (the matrix-table and chart in report-v2 are created in the same way (have the same fields), only the visualization-mode is different.
Note that the report-elements are connected: if you  use in report-v1 the Slicer to filter the competition 'Champions League' (CL), all report-elements only show the goal-totals of the CL-competition, see fig.6.

     fig.6: Slicer, Competition = 'Champions League' (CL)

Or if you filter in the chart with the goals per month = Dec., all report elements are filtered for Dec., see fig.7.


   fig.7: Filter in bar-chart Goals per month = Dec.


Or if you use the filter in the filter-pane and filter on an opponent team, e.g. "Rayo Vallecano", all report-elements only show goals Messi made against this team (Rayo), see fig.8.

     fig.8: Filter in filter-view pane, opponent-team = Rayo.

When I finished the report, I exported (published) it to a PDF-file (also included in downloads below).

So with this post I wanted to show you the reporting-possibilities of Excel and PowerView. For another example, see my post about the Sochi Winter Games:

http://worktimesheet2014.blogspot.com/2014/05/excel-2013-and-business-intelligence.html


Interesting Links
 
On my research for this post I found some interesting links, including videos with the 91 goals from Messi, from which you should see at least one of the first 2. Or if you don´t have so much time, watch only the 3d video, with maybe Messi´s best goal ever, which he made when he was only 19.

Videos Messi:

*1
Lionel Messi - All 91 Goals in 2012 with Commentary

*2
Los 91 Goles De Leo Messi En 2012

*3
Lionel Messi Goal vs Getafe

*4
https://youtu.be/8o_Lionel Messi - EL D10S - Short Movie |HD

*5
Lionel Messi - The Magician - 2015 ● Skills ,Goals ,Dribbles , Assists |HD


Infographics Messi´s 91 goals:

*1 positions field from where Messi scored
http://i.imgur.com/ewq4Y.jpg 
http://www.headingfortheexits.com/messi91/

*2
Messi vs Mueller

 *3
http://www.fcbarcelona.com/football/first-team/messi-91-goals-2012-world-record-infographic

 *4
 Statistics career Messi with Barcelona

*5
http://bleacherreport.com/articles/1456355-breaking-down-lionel-messis-magical-91-goal-year-for-barcelona-and-argentina


Business Intelligence with Excel and Powerview

*1
Getting Started With Power View In Excel 2013 

*2
Creating KPI dashboard using Excel 2013 PowerPivot

*3
From Data to Insight & Impact: Building a Sales Summary with Power View

*4
Excel 2013 Power BI Tools Part 17 - Filters in Power View


Downloads:

#Mirror 1: Scribd.com (PDF file report-V2):

https://es.scribd.com/doc/274861437/GoalsMessi2012-v2-R1-PDF

#Mirror 2: MS Onedrive (Excel file report-V2):
NB: this site has 'Excel-Online', so you can view my Excel-doc if you don´t have MS Excel on your PC

http://1drv.ms/1hiNhFP

#Mirror 3: Google Drive (1 zip file with Excel and PDF files report V1 and V2):
https://goo.gl/Ttkzmz