2 Feb 2021

AEMET Open Data for weather in Spain, analysis with Python


 #74: AEMET Open Data for weather in Spain, analysis with Python

2021 started in Spain with extreme weather caused by storm Filomena, with heavy snowfall, and extreme low temperatures, and with a record of -34 C, see:
https://www.lavanguardia.com/natural/20210108/6173987/record-frio-34o-c-sera-reconocido-agencia-meteorologia.html

When I looked on the site of AEMET ("The State Meteorological Agency", an agency of the Government of Spain), to find more information about Filomena, I saw they offer open data via a REST-API, see: https://opendata.aemet.es/centrodedescargas/AEMETApi?

For how to use this API, see this video by AEMET (starting at min. 25): https://www.youtube.com/watch?v=l-YF_dQ983Y&feature=emb_logo

I tested it with this URI for extreme temperatures, see:
https://opendata.aemet.es/dist/index.html?#/valores-climatologicos

GET /api/valores/climatologicos/valoresextremos/parametro/{parametro}/estacion/{idema}


and for the parameters I chose:
- value: temperature (in decimal degrees Celcius, so e.g. -1.0 C = -10 dC
- weather station (IDEMA-code): 2462 - PUERTO DE NAVACERRADA (ski-resort of Madrid, see: http://puertonavacerrada.com/).


Jupyter Notebook

I made a Jupyter notebook in Python to visualize the result of this API-call, and run it in Google Colab (Colaboratory), see FIG.1


FIG.1: Jupyter notebook with min.temperatures in Navacerrada 
     (with min.temp. of -203 'decigrado Celcius = -20.3 C in 1962). 
 
NB: 
- For 1962 there are duplicate lines, so it looks like AEMET forgot to clean this data (de-duplicate) 
- 1956 was one of the coldest winters in Spain and the temp. of -18.6 in Navacerrada was the 4th coldest temp. that winter, see:
 

You can run this notebook for another weather station by replacing in the GET-statement the IDEMA-code for the station in Navacerrada (2462). To get the IDEMA-code of a station, see e.g. :

I run it, so Google Colab, from my Android-phone, for the province of Teruel (IDEMA-code: 8368U), which had one of the lowest temperatures during Filomena, with this result (note that Jan. 2021-1, with -21C, was the coldest month in the history of Teruel).


FIG.1b: Jupyter notebook run on Android-phone for province Teruel


I used besides Google Colab, also Binder and a JupyterLab-demo project to run the notebook, see FIG.2b and:

 
FIG.2b: Jupyter Notebook in Binder

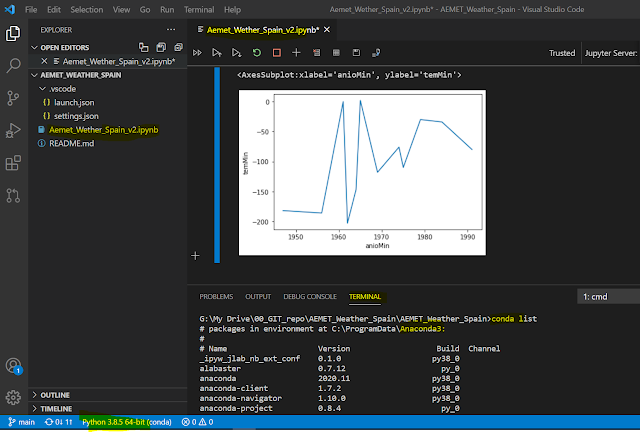
And I also used Microsoft Visual Code (open source IDE, multi-platform, multi-language) and Anaconda (tool for data science with Python and R) to run the notebook, see FIG.2c.

FIG.2c: Jupyter Notebook in VS Code


API

The API-result consists of a JSON-file that has 2 URLs: one for the actual data and one for the meta-data, and these are also in JSON-format, see FIG.3-5

FIG.3 : result API-call


FIG.4: actual data (JSON-format)


FIG.5: meta data (JSON-format)


Chart

For the chart, I selected (in the notebook) these columns:
- name of weather station ('nombre')
- min.temperature, in 'deci-grados' Celcius ('temMin')
- date of measurement ('anioMin' (year), 'mesMin' (month), 'diaMin' (day))

To store the JSON-data returned by the API, I used a dataframe of the Pandas-library and for the data viz (line-chart) I used the Seaborn-library.


To conclude this post, here a link with some photos of how my neighborhood in Madrid looked like when it was covered in the Filomena-snow:

If you liked this post, you can leave a comment below (non-anonymous, to prevent spam).
And if you'd like to donate something, check the Donate (via PayPal) button on the top-right.


References:


Python Tutorial | How to use a Jupyter notebook online with Binder and Google Colab


Webinar AEMET Open Data
 
Google Colab turorial

Data Visualization using Python on Jupyter Notebook" en YouTube

Filomena snowstorm

VS Code :


Using VS Code with Python for Data Science / Data Analysis


Anaconda:


Downloads:

Jupyter Notebook: 


#Mirror 2 - Google Colab:


5 Jan 2021

Messi Goal Tracker dashboard in Google Data Studio

  #73: Messi Goal Tracker dashboard in Google Data Studio

 
Update 11/9/2023
 
Begin Update
 
Because of Messi's transfer to Inter Miami I had to update my Messi-goal-tracker GoogleDataStudio-report to include the goals that he made for his new club.
And I included another page to see easily the #goals he made per club and competition.


End Update 11/9/2023
 
  
Update 3/10/2021:
 
Begin Update
Now Messi moved to Paris Saint-Germain (PSG), I had to change my Messi-goal-tracker GoogleDataStudio-report a bit, to reflect e.g. if a goal he scored in the Champions League was a goal for FC Barcelona or for PSG.

I below screenshot you can see how the new dashboard looks like:


I leave it to you to find the differences/improvements with the previous version of the dashboard (see FIG.1 below) ;) But screenshot below, which has a filter on opponent Manchester City, against which Messi made hist 1st goal for PSG this week, could help you.


End Update
 
When Messi made on 22/12/2020 his 644-th goal for FC Barcelona, he broke the 46 year old record '# goals made for one club' of Pele (who made 643 goals for Santos). See e.g.:
https://www.espn.in/football/barcelona/story/4215713/barcelonas-messi-overtakes-peles-scoring-record-with-644-goals-for-the-club

or (in Spanish, with a chart with a breakdown of the 644 goals by competiton):
https://www.mundodeportivo.com/futbol/fc-barcelona/20201223/491248765482/barca-valladolid.html

This new record of Messi inspired me to make a new Messi-dashboard.
The previous Messi-dashboards I made, for his record '# goals made in one year' 
(91 goals in 2012), see posts:

https://worktimesheet2014.blogspot.com/2015/08/dashboard-for-messis-worldrecord-of-91.html 

https://worktimesheet2014.blogspot.com/2016/12/powerbi-dashboard-for-messis.html

https://worktimesheet2014.blogspot.com/2020/01/google-data-studio-dashboard-for-messi.html

were 'static snapshots'.  This time I wanted to make a 'live-dashboard', so one that is automatically updated after each match of Messi in which he scored. So that when Messi retires in Barcelona (or leaves to another club, which might happen at the end of this season (2020-2021)..), this dashboard shows his final score (so which will probably be more than the current 644 goals).
In FIG.1 you can see my dashboard, and for the dashboard in Google Data Studio, see: https://datastudio.google.com/s/lZaGsxWsomc
And at the bottom of this post there is also an embedded version of the dashboard.


FIG.1: Messi (live) dashboard, showing his record '644-goals for one club' (Barca).


Datasource

I found this Power BI Messi-dashboard of Microsoft Data Platform MVP Tristan Malherbe:
https://community.powerbi.com/t5/Data-Stories-Gallery/Incredible-Lionel-Messi/td-p/82225 that uses this (live) datasource: https://messi.starplayerstats.com/en ,
which is made by Dutch sports journalist Ramon Min.
So I decided to use this datasource as well. 
I used Google Sheets to import this data, using this function:

=IMPORTHTML("https://messi.starplayerstats.com/en/goals/0/0/all/0/0/0/t/all/all/0/0/1","table",1)

see also FIG.2


https://docs.google.com/spreadsheets/d/13Z81oKYbcyXSiETIEd_HT-L7_pzJfL7YjKC_ISyrhD8/edit?usp=sharing

FIG.2: G-Sheets with import of data of Messi-stats website

For this spreadsheet, the settings for (re)calculation are 'on change and after every hour', so once R. Min has updated his website (which he does after every Messi-match), in max. 1 hour my G-Sheet is also updated.
See also:
https://webapps.stackexchange.com/questions/6776/what-are-the-refresh-characteristics-of-the-google-spreadsheet-import-functions

Dashboard

I made the dashboard in Google Data Studio (GDS). To make the source-data better for reporting, I created some extra fields, e.g. 'Competition', that for international competitions (so where Messi plays for Argentina) aggregates all goals for one 'competition-type'. So instead of having the goals of Messi in World Cup seperate by year/edition (as the datasource has), using field 'Competition' in my dashboard you get the sum of all World Cup goals that Messi made.
For the datamodel of the dashboard and the formula used for field 'Competiton', see FIG.3-4

FIG.2: datamodel of dashboard


FIG.3: formula for field 'Competition' of datamodel 

I wanted to keep my dashboard simple, so with just the basic data: 
- dimensions: date, competition (-> team for which Messi played), opponent
- fact: #goals
So more detailed (dimension-)data of how Messi scored (penalti, left-foot etc.) I left out of the dashboard. 

I chose to set report-setting 'enable viewer filters in report link' to 'true', so that it is possible to make a snapshot of the dashboard for a certain filter-value, broke a record, see e.g. FIG.4.


FIG.4: Messi's 2012-record: '#goals in 1 year', so with report-filter: Year = 2012
https://datastudio.google.com/s/ji-MWIO5TuI
or:
https://datastudio.google.com/u/1/reporting/9d51c83b-11ea-44eb-b4dd-20a8ca54fd8a/page/JS6uB?params=%7B%22df7%22:%22include%25EE%2580%25801%25EE%2580%2580IN%25EE%2580%25802012%22%7D

For the bar-charts, I set the colors for Messi's teams (Barca and Argentina) according to the shirt-colors of these teams, see e.g.: https://www.schemecolor.com/fc-barcelona.php

The data in the charts are sorted by metric ('Goal#', in descending order), but you can change this in e.g. sort by dimension 'Year'.

The dashboard is interactive (e.g. it has filters and all charts are connected so that if you filter in one of them, the others get filtered as well), so you can explore the data. For some of my own explorations, see below figures.


FIG.5: matches in Messi's top-year 2012 in which he made 3 or more goals
NB: note that Messi made against Bayer Leverkussen 5 goals, the first player ever to do this in a Champions League match,  see: https://youtu.be/HtMU0x1L4EU


FIG.6: Goals made in Champions League


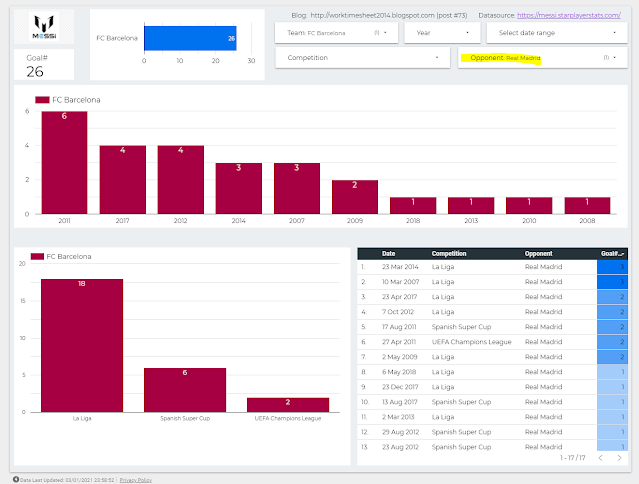
FIG.7: Goals made against Real Madrid


To celebrate this new record of Messi, his sponser Budweiser sent to the 160 goalkeepers of the teams against which Messi scored his 644 goals, special 'Messi-beer', see e.g:

https://www.givemesport.com/1631804-lionel-messi-which-goalkeepers-got-the-644-bottles-of-budweiser-beer

https://www.thedrum.com/news/2020/12/30/budweiser-bestows-beer-upon-each-the-160-goal-keepers-lionel-messi-scored#:~:text=Today%2C%20we're%20talking%20about,these%20goals%20%E2%80%93%20some%20120%20keepers.

If you liked this post and want to buy me a Budweiser, click on the PayPal-Donate button on the top-right of this post ;)

Cheers and best wishes for 2021.


References

https://messi.com/en/estadisticas-barcelona/

https://www.transfermarkt.com/lionel-messi/alletore/spieler/28003

https://www.theguardian.com/football/2021/jan/01/pele-revolutionary-status-must-survive-numbers-game-against-lionel-messi-santos

https://medium.com/totalfootball/why-pele-remains-the-greatest-footballer-of-all-time-1fc00bea0120

https://www.90min.com/posts/3062276-forget-pele-maradona-messi-and-ronaldo-johan-cruyff-has-to-be-greatest-of-all-time


Downloads

PDF of dashboard


Embedded Dashboard

<iframe width="600" height="450" src="https://datastudio.google.com/embed/reporting/9d51c83b-11ea-44eb-b4dd-20a8ca54fd8a/page/JS6uB" frameborder="0" style="border:0" allowfullscreen></iframe>


29 Dec 2020

Tableau-dashboard COVID-19 in the Netherlands with CoronaWatchNL-data

 #72: Tableau-dashboard "COVID-19 in the Netherlands" with CoronaWatchNL-data

My previous post was about a Google Data Studio (GDS)  COVID-19 dashboard I made. GDS-reports are meant for viewing on a PC, not for mobile devices, as the GDS-canvas doesn't have a responsive design, although there is a way to make a (embedded) GDR-report reponsive, see e.g. : https://kpis.studio/blog/mobile-friendly-data-studio/

But I decided to make a new COVID-19 dashboard, this time with Tableau, as the Tableau-canvas does have a responsive design, or better said: a "device specific designer", see e.g. Design for mobile devices (device specific designer). And I also choose Tableau because I was inspired by the "Tableau & Visual Analytics inspiration-session' we had at work, in which I saw things of Tableau that I wanted to try myself. For the end-result of my first Tableau- experiment, see FIG.1. And for Tableau-workbook and the 'live' (embedded) dashboard, see the bottom of this post. And the live dashboard you can also find here:
https://public.tableau.com/shared/SH2PRJH77?:display_count=y&:origin=viz_share_link


FIG.1: my COVID-19 Tableau dashboard with responsive design, so works both for PC as mobile

To create my dashboard I used the free version of Tableau, Tableau Public 2020.3 (vs the Tableau Desktop client, for which you need a license). This version has the limitation that you can't save your dashboard locally, but only on the web, here:
https://public.tableau.com

So this makes your dashboard publically available once you saved (=published) it (for my dashboard that was on 2/12/2020). When I searched for my dashboard (using 'covid-19 netherlands'), I found it, with ranking #2 (se FIG.2). I'm not sure why my dashboard was ranked so high in the 35K(..) results for my search , but maybe it helped that my dashboard is automatically updated each day, which is not true for the other top 6 dashboards in FIG.2.  Later I'll explain how this can be done with Tableau Public, but this wouldn't have been possible of course if my datasource, CoronaWatchNL, wasn't updated daily as well (for more details about this datasource, see my previous post). 
Out of curiousity I checked if there were other COVID-19 dashboards that used CoronaWatchNL, and I found one, see FIG.3 
and for the (very nice) dashboard, see: 
https://public.tableau.com/views/CoronaMonitorNoord-Brabant/OntwikkelingNederland?:language=en-GB&:display_count=y&:origin=viz_share_link


FIG.2: my Tableau dashboard on Tableau Public cloud


FIG.3: (other) COVID-19 dashboards that use open data of CoronaWatchNL


Now more details about my dashboard:

Datasources

My dashboard has 2 datasource, the same 2 Google Sheets (that import data of CoronaWatchNL) that I used to create my Google Data Studio (GDS) dashboard. For the details of these datasources, see:
- Datasource 1: RIVM_NL_municipal_latest.csv 
- Datasource 2: RIVM_NL_national.csv
Remember that these Google Sheets get updated automatically as soon as CoronaWatchNL has new data. And to get a 'live' dashboard in Tableau Public, you have to select 'Keep my data in sync with Google Sheets..' when you save the Tableau-workbook, see for more details e.g.:


https://www.thedataschool.com.au/nicholas-hills/how-to-create-a-dynamic-dashboard-for-coronavirus-with-google-sheets-and-tableau/

For datasource-1, with geo-data, I set the 'Geographic Role' for the geo-columns as Country :


And for field 'Type' (of COVID-19 case), which has (3) possible values and are in Dutch in the datasource, I created alias-values in English:


Dashboard and Charts

The 2 charts you see in the dashboard have different datasources: 
the Map-chart uses Datasource 1(RIVM_NL_municipal_latest.csv)  and the Line-chart uses Datasource 2 (RIVM_NL_national.csv). So these charts are not 'connected' (filtering in one chart has no effect on the other chart).

I made 2 dashboard-versions, one for PC (see FIG.4a) and one for mobile phone (see FIG.4B).

FIG.4a: PC-dashboard


FIG.4b: Mobile-dashboard + designer

I started with the one for PC (desktop), and this one I used as a start the the mobile version. I wanted to fit both the Map-chart and the Line-chart in one screen (of a mobile phone), so that the mobile user has (more or less) the same user experience as the PC user, so he can see the current state of COVID-19 in the Netherlands by city (in the Map-chart) and the COVID-19 'curve' (the Line-chart).
For this, I had to eliminate some widgets (e.g. the date-and location-filters). If the mobile user would like to see more details or have more interaction-options (for filtering), he should use the PC-dashboard.
NB: I could have been better to use different 'tabs' for the map- and line-chart, see for an nice (responsive) dashboard that does this: https://covid19.innouveau.com/#/
(TODO)

To get the 2 charts in the mobile dashboard (vertically) aligned and fitting in 1 screen, I used a Vertical Container. For more details how this works, see e.g. :
How to Lay Out a Dashboard in Tableau


Map-chart 

I made the (Dual-axis) Map-chart, with the colored Provinces and sized Cities/Municipalities, following this Tableau Tutorial ("Maps with shaded States and sized Cities"):
https://www.youtube.com/watch?v=3VAolG-YEa0 
It's a pity that many locations on the map are unrecognized.
I checked with a Tableau expert at my work, and she said:
"With Tableau maps there is a limitation, in the sense that it cannot plot all the locations automatically. This can be overcome with custom geocoding (they offer resources for that online)"
(TODO) 
I did solve the issue for one city (The Hague, in Dutch: 'Den Haag' or 's‑Gravenhage) manually, see FIG.5 how I did this.

FIG.5: screen to manually fix unrecognized locations


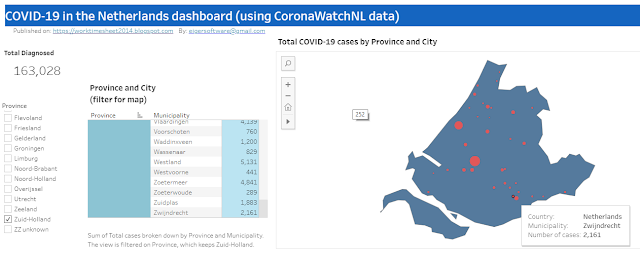
The map has the option to drill-down (province -> city/municipality), see FIG.6.
For this, I created a 'geo-hierarchy' in the dataset, see FIG.7

FIG.6: Drill-down for province Zuid-Holland to municipality Zwijndrecht


FIG.7: Map-chart with datasource


Line-chart

The line-chart shows both the total (in orange) and new (in blue) COVID-19 cases, where you can select which metric to use for #case:
  • Diagnosed ('Totaal')
  • Hospitalized ('Ziekenhuis opname')
  • Deceased ('Overleden')


FIG.8: Line-chart with datasource


Story

Besides dashboards, you can also create 'stories' in Tableau. As written here:

.. a story is a sequence of visualizations that work together to convey information. You can create stories to tell a data narrative, provide context, demonstrate how decisions relate to outcomes, or to simply make a compelling case.

..a story is also a collection of sheets, arranged in a sequence. Each individual sheet in a story is called a story point.

And for how to create a story in Tableau, see: 
https://help.tableau.com/current/pro/desktop/en-us/story_create.htm

In my story (see FIG.9), there are 3 'story-points', which are the line-charts for the 3 different metrics (Diagnosed, Hospitalized, Deceased) and this story I could use if I would like to ask to someone with more knowledge of the COVID-19 situation in the Netherlands (NL), why in the Diagnosed-chart there was no 'spike' in the outbreak (in April 2020) of  COVID-19 in NL while in the Hospitalized/Deceased-charts there is a spike for the 1st wave (answer would probably be: there was almost no testing then).


FIG.9: Story (2 of the 3 story-points) with the line-chart for different metrics

N.B:
In this post I marked some pending things in my dashboard with "TODO" . I might do this later... 


References

https://public.tableau.com/en-us/s/covid-19-viz-gallery

https://www.tableau.com/covid-19-coronavirus-data-resources

https://www.tableau.com/covid-19-coronavirus-data-resources/global-tracker

https://public.tableau.com/profile/deloitte.visual.analytics#!/vizhome/DeloitteCOVID-19EconomicRecoveryDashboard/DeloitteCOVID-19Analysis

https://help.tableau.com/current/pro/desktop/en-us/default.htm

Tableau Desktop vs Public vs Reader


Downloads

Tableau-workbook


Embedded (live) Dashboard

i-frame:

<div class='tableauPlaceholder' id='viz1609218470236' style='position: relative'><noscript><a href='#'><img alt=' ' src='https:&#47;&#47;public.tableau.com&#47;static&#47;images&#47;CO&#47;COVID-19NetherlandsmapwithopendataofCoronaWatchNL&#47;Dashboard1-PC&#47;1_rss.png' style='border: none' /></a></noscript><object class='tableauViz'  style='display:none;'><param name='host_url' value='https%3A%2F%2Fpublic.tableau.com%2F' /> <param name='embed_code_version' value='3' /> <param name='site_root' value='' /><param name='name' value='COVID-19NetherlandsmapwithopendataofCoronaWatchNL&#47;Dashboard1-PC' /><param name='tabs' value='yes' /><param name='toolbar' value='yes' /><param name='static_image' value='https:&#47;&#47;public.tableau.com&#47;static&#47;images&#47;CO&#47;COVID-19NetherlandsmapwithopendataofCoronaWatchNL&#47;Dashboard1-PC&#47;1.png' /> <param name='animate_transition' value='yes' /><param name='display_static_image' value='yes' /><param name='display_spinner' value='yes' /><param name='display_overlay' value='yes' /><param name='display_count' value='yes' /><param name='language' value='en-GB' /><param name='filter' value='publish=yes' /></object></div>                <script type='text/javascript'>                    var divElement = document.getElementById('viz1609218470236');                    var vizElement = divElement.getElementsByTagName('object')[0];                    vizElement.style.width='100%';vizElement.style.height=(divElement.offsetWidth*0.75)+'px';                    var scriptElement = document.createElement('script');                    scriptElement.src = 'https://public.tableau.com/javascripts/api/viz_v1.js';                    vizElement.parentNode.insertBefore(scriptElement, vizElement);                </script>