Showing posts with label Google Data Studio. Show all posts

27 Mar 2022

Google Data Studio report of Ukraine-refugees and destination-countries


#82: Google Data Studio report of Ukraine-refugees and destination-countries


The war between Ukraine and Russia is already going on for more than a month now, and the number of Ukraine-refugees who fled to a neighbor-country is close to 4M now. Also another 6M people fled to other safer regions in Ukraine. So in total aprox. 10M have left their homes now. Of them aprox. 4M are children, which is about half of the country's children, see e.g.:

https://www.washingtonpost.com/kidspost/2022/03/26/war-ukraine-has-forced-half-nations-children-flee-their-homes/

https://www.bbc.com/news/world-60555472


A previous post was about a Power BI report that I made with as a source UNHCR-data of Ukraine-refugees, see:

https://worktimesheet2014.blogspot.com/2022/03/power-bi-flow-map-of-ukraine-refugees.html.


In this post I made a similar report, but now with Google Data Studio:

https://datastudio.google.com/reporting/53d717be-f008-49b9-bc67-a2daeece66b7


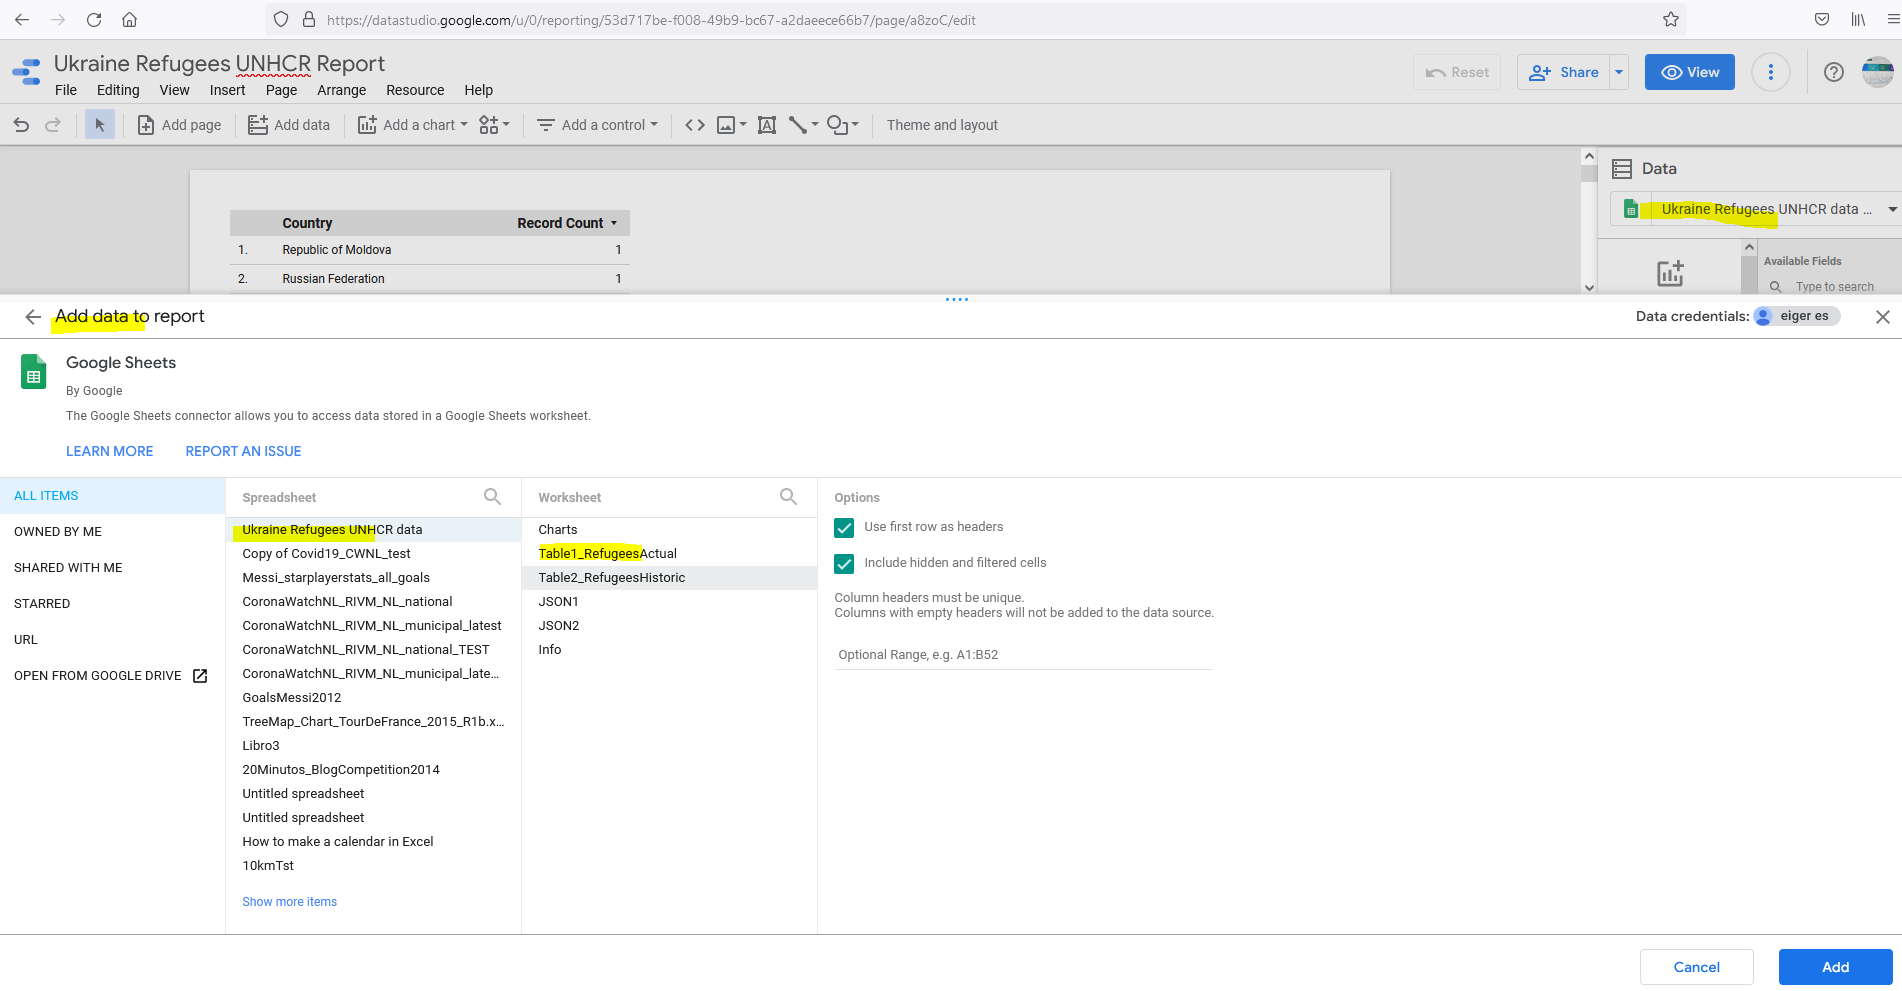
The data-source of this report is a Google-Sheets that I made:

https://docs.google.com/spreadsheets/d/e/2PACX-1vSX2Oxyqwy6qA2RBRkBkmvlEu_npVea1ZPp6bE7AWBxue6rRIUhL2r_-53iQXyLqPoRH7LyvLMlw4S3/pubhtml

Here I import the JSON-files of the UNHCR data-portal. G-Sheets does not have a built-in function do do this, but there is a G-Sheets extension for this which I used:

https://nodatanobusiness.com/resources/importjson-your-first-importjson-function/

https://www.youtube.com/watch?v=EXKhVQU37WM - IMPORTJSON Function - Google Sheets Tutorial - How to Import JSON feed to Spreadsheets


NB: This add-on has a limit of  #refreshes per day (100), but it looks there is a workaround:
https://discourse.gbif.org/t/api-importjson-spreadsheet-quota-limit-reached/2218

To format this data in table-format and in a separate worksheet (needed for Google Data Studio), I defined named ranges and used the QUERY-function:

https://infoinspired.com/google-docs/spreadsheet/learn-query-function-with-examples-in-google-sheets/

 https://www.youtube.com/watch?v=kQ7DKx3eZQg - Create a Data Table in Google Sheets Like Excel


PEACE TO UKRAINE !

Source:

https://euromaidanpress.com/2014/03/02/russian-designer-creates-icon-for-peace-in-ukraine-using-the-shapes-of-the-national-symbolic/


References

https://www.statista.com/study/86697/russia-ukraine-conflict/#professional

https://www.forbes.com/sites/rashishrivastava/2022/03/15/how-one-google-doc-is-helping-thousands-of-ukrainian-refugees-navigate-borders/?sh=6c2fd8fed18e

https://twitter.com/Schwarzenegger/status/1504426844199669762 

https://eacnur.org/es


Embedded Report


5 Jan 2021

Messi Goal Tracker dashboard in Google Data Studio

  #73: Messi Goal Tracker dashboard in Google Data Studio

 
Update 11/9/2023
 
Begin Update
 
Because of Messi's transfer to Inter Miami I had to update my Messi-goal-tracker GoogleDataStudio-report to include the goals that he made for his new club.
And I included another page to see easily the #goals he made per club and competition.


End Update 11/9/2023
 
  
Update 3/10/2021:
 
Begin Update
Now Messi moved to Paris Saint-Germain (PSG), I had to change my Messi-goal-tracker GoogleDataStudio-report a bit, to reflect e.g. if a goal he scored in the Champions League was a goal for FC Barcelona or for PSG.

I below screenshot you can see how the new dashboard looks like:


I leave it to you to find the differences/improvements with the previous version of the dashboard (see FIG.1 below) ;) But screenshot below, which has a filter on opponent Manchester City, against which Messi made hist 1st goal for PSG this week, could help you.


End Update
 
When Messi made on 22/12/2020 his 644-th goal for FC Barcelona, he broke the 46 year old record '# goals made for one club' of Pele (who made 643 goals for Santos). See e.g.:
https://www.espn.in/football/barcelona/story/4215713/barcelonas-messi-overtakes-peles-scoring-record-with-644-goals-for-the-club

or (in Spanish, with a chart with a breakdown of the 644 goals by competiton):
https://www.mundodeportivo.com/futbol/fc-barcelona/20201223/491248765482/barca-valladolid.html

This new record of Messi inspired me to make a new Messi-dashboard.
The previous Messi-dashboards I made, for his record '# goals made in one year' 
(91 goals in 2012), see posts:

https://worktimesheet2014.blogspot.com/2015/08/dashboard-for-messis-worldrecord-of-91.html 

https://worktimesheet2014.blogspot.com/2016/12/powerbi-dashboard-for-messis.html

https://worktimesheet2014.blogspot.com/2020/01/google-data-studio-dashboard-for-messi.html

were 'static snapshots'.  This time I wanted to make a 'live-dashboard', so one that is automatically updated after each match of Messi in which he scored. So that when Messi retires in Barcelona (or leaves to another club, which might happen at the end of this season (2020-2021)..), this dashboard shows his final score (so which will probably be more than the current 644 goals).
In FIG.1 you can see my dashboard, and for the dashboard in Google Data Studio, see: https://datastudio.google.com/s/lZaGsxWsomc
And at the bottom of this post there is also an embedded version of the dashboard.


FIG.1: Messi (live) dashboard, showing his record '644-goals for one club' (Barca).


Datasource

I found this Power BI Messi-dashboard of Microsoft Data Platform MVP Tristan Malherbe:
https://community.powerbi.com/t5/Data-Stories-Gallery/Incredible-Lionel-Messi/td-p/82225 that uses this (live) datasource: https://messi.starplayerstats.com/en ,
which is made by Dutch sports journalist Ramon Min.
So I decided to use this datasource as well. 
I used Google Sheets to import this data, using this function:

=IMPORTHTML("https://messi.starplayerstats.com/en/goals/0/0/all/0/0/0/t/all/all/0/0/1","table",1)

see also FIG.2


https://docs.google.com/spreadsheets/d/13Z81oKYbcyXSiETIEd_HT-L7_pzJfL7YjKC_ISyrhD8/edit?usp=sharing

FIG.2: G-Sheets with import of data of Messi-stats website

For this spreadsheet, the settings for (re)calculation are 'on change and after every hour', so once R. Min has updated his website (which he does after every Messi-match), in max. 1 hour my G-Sheet is also updated.
See also:
https://webapps.stackexchange.com/questions/6776/what-are-the-refresh-characteristics-of-the-google-spreadsheet-import-functions

Dashboard

I made the dashboard in Google Data Studio (GDS). To make the source-data better for reporting, I created some extra fields, e.g. 'Competition', that for international competitions (so where Messi plays for Argentina) aggregates all goals for one 'competition-type'. So instead of having the goals of Messi in World Cup seperate by year/edition (as the datasource has), using field 'Competition' in my dashboard you get the sum of all World Cup goals that Messi made.
For the datamodel of the dashboard and the formula used for field 'Competiton', see FIG.3-4

FIG.2: datamodel of dashboard


FIG.3: formula for field 'Competition' of datamodel 

I wanted to keep my dashboard simple, so with just the basic data: 
- dimensions: date, competition (-> team for which Messi played), opponent
- fact: #goals
So more detailed (dimension-)data of how Messi scored (penalti, left-foot etc.) I left out of the dashboard. 

I chose to set report-setting 'enable viewer filters in report link' to 'true', so that it is possible to make a snapshot of the dashboard for a certain filter-value, broke a record, see e.g. FIG.4.


FIG.4: Messi's 2012-record: '#goals in 1 year', so with report-filter: Year = 2012
https://datastudio.google.com/s/ji-MWIO5TuI
or:
https://datastudio.google.com/u/1/reporting/9d51c83b-11ea-44eb-b4dd-20a8ca54fd8a/page/JS6uB?params=%7B%22df7%22:%22include%25EE%2580%25801%25EE%2580%2580IN%25EE%2580%25802012%22%7D

For the bar-charts, I set the colors for Messi's teams (Barca and Argentina) according to the shirt-colors of these teams, see e.g.: https://www.schemecolor.com/fc-barcelona.php

The data in the charts are sorted by metric ('Goal#', in descending order), but you can change this in e.g. sort by dimension 'Year'.

The dashboard is interactive (e.g. it has filters and all charts are connected so that if you filter in one of them, the others get filtered as well), so you can explore the data. For some of my own explorations, see below figures.


FIG.5: matches in Messi's top-year 2012 in which he made 3 or more goals
NB: note that Messi made against Bayer Leverkussen 5 goals, the first player ever to do this in a Champions League match,  see: https://youtu.be/HtMU0x1L4EU


FIG.6: Goals made in Champions League


FIG.7: Goals made against Real Madrid


To celebrate this new record of Messi, his sponser Budweiser sent to the 160 goalkeepers of the teams against which Messi scored his 644 goals, special 'Messi-beer', see e.g:

https://www.givemesport.com/1631804-lionel-messi-which-goalkeepers-got-the-644-bottles-of-budweiser-beer

https://www.thedrum.com/news/2020/12/30/budweiser-bestows-beer-upon-each-the-160-goal-keepers-lionel-messi-scored#:~:text=Today%2C%20we're%20talking%20about,these%20goals%20%E2%80%93%20some%20120%20keepers.

If you liked this post and want to buy me a Budweiser, click on the PayPal-Donate button on the top-right of this post ;)

Cheers and best wishes for 2021.


References

https://messi.com/en/estadisticas-barcelona/

https://www.transfermarkt.com/lionel-messi/alletore/spieler/28003

https://www.theguardian.com/football/2021/jan/01/pele-revolutionary-status-must-survive-numbers-game-against-lionel-messi-santos

https://medium.com/totalfootball/why-pele-remains-the-greatest-footballer-of-all-time-1fc00bea0120

https://www.90min.com/posts/3062276-forget-pele-maradona-messi-and-ronaldo-johan-cruyff-has-to-be-greatest-of-all-time


Downloads

PDF of dashboard


Embedded Dashboard

<iframe width="600" height="450" src="https://datastudio.google.com/embed/reporting/9d51c83b-11ea-44eb-b4dd-20a8ca54fd8a/page/JS6uB" frameborder="0" style="border:0" allowfullscreen></iframe>


29 Nov 2020

COVID-19 in the Netherlands live dashboard with Google Data Studio and open data of CoronaWatchNL


#71: "COVID-19 in the Netherlands" live dashboard with Google Data Studio and open data of CoronaWatchNL

In march I made my first "COVID-19 in the Netherlands dashboard", in Microsoft Power BI , based on the open data on:  https://github.com/J535D165/CoronaWatchNL
made by:  Jonathan de Bruin of Utrecht University 
and for the post about that dashboard, see: 
https://worktimesheet2014.blogspot.com/2020/03/coronovirus-in-netherlands-power-bi.html

Last week I got news from J. de Bruin that his CoronaWatchNL project won the 'Dutch Data prize', a prize for researchers who make (research-)data available for further research, so to offer it as open data, or as much open as possible, also called fair data.  For more details about this prize and CoronaWatchNL, see:

https://www.uu.nl/en/news/jonathan-de-bruin-wins-dutch-data-prize-with-his-project-coronawatchnl

https://zenodo.org/record/4278891#.X7UUishKiUk

https://researchdata.nl/diensten/dataprijs/

https://www.go-fair.org/fair-principles/

and for a video with the award ceremony with J. de Bruin, see: 

https://www.youtube.com/watch?v=uSJ_2_c_xt4&list=PLGCrt17ZLM3SkHfWvjM8j401D8tR35Wk4&index=2

(starting at min. 8:53).

In the email that J. de Bruin sent to me and some others who participated in his project, to tell us the news, he said that this award was also ours, although I must say my contribution was relatively small compared to the tremendous work he did (and still does). 

The success of CoronaWatchNL stimulated me to make a new (and better) dashboard, as my first one was not up-to-date anymore. To refresh the data in that (Power BI) dashboard I had to do some manual work because the datasource was a local CSV-file, which I downloaded daily  from CoronaWatchNL, and that I than processed in my (local) Power BI report, which in the end I had to upload to the Power BI cloud.  
The new 'live' dashboard for the CoronaWatchNL data, I made with Google Data Studio (GDS), which has a datasource a Google-Sheet with a formula that imports the CoronaWatchNL data, and gets automatically refreshed once the CoronaWatchNL data is updated (daily at aprox 16:00). 
The 'dashboard' actually consists of 2 GDS-reports, in 2 UX-flavors (a: Light theme and b: Dark theme), see FIG.1-4 for the screenshots, the URLs and the i-frames of the 4 reports (for embedding the report in a website). And at the end of this post, you can also see the embedded reports (which are always up-to-date).


FIG.1a: COVID-19 in the Netherlands dashboard (part 1/2) - Number of cases by province and city (Light theme)


NB: 
- report says 'City', but it is actually 'Municipality'.
- the data in the top-right of the header is the date of the datasource, which is refreshed at aprox. 16:00. 


FIG.1b: COVID-19 in the Netherlands dashboard (part 1/2) - Number of cases by province and city (Dark theme)

https://datastudio.google.com/s/vNqnsHxKDkI

<iframe width="600" height="450" src="https://datastudio.google.com/embed/reporting/ddb639ef-c243-4941-854e-ef10845a1658/page/xuVpB" frameborder="0" style="border:0" allowfullscreen></iframe>


FIG.2a: COVID-19 in the Netherlands dashboard (part 2/2) - Number of cases over time  (Light theme)


FIG.2b:  COVID-19 in the Netherlands dashboard (part 2/2) - Number of cases over time  (Dark theme)

https://datastudio.google.com/s/vQqMgu-tdfg

<iframe width="600" height="450" src="https://datastudio.google.com/embed/reporting/d0e15dd4-e4e0-46a1-9879-ccd5353a5c42/page/lPmpB" frameborder="0" style="border:0" allowfullscreen></iframe>


If you want to use the URLs above in your website, but you want to use a different filter than the default filter, then copy the URL after you applied the filter. As you can see in FIG.3, the URL now has the applied filter in it. 
This is because I enabled the 'custom bookmark links' feature of GDS for the dashboard. See:  https://www.clickinsight.ca/blog/using-bookmark-links-in-data-studio


FIG.3: URL with filter Province = 'Zuid Holland'


The dashboard is interactive, so you can filter, drill-down or choose different metrics, see FIG4 a-b. for some examples. 

FIG.4a: Drill down for Province = 'Zuid Holland' to City


FIG.4b: change the (default) metrics (total/new numbers) for the optional metrics (percentages) 


The datasources I used for these reports are:

Datasource 1: RIVM_NL_municipal_latest.csv

https://docs.google.com/spreadsheets/d/1lKWmtYl5hhnlHzqQv2Y6PQcadVdNuI0Pz-VxttRICeA/edit?usp=sharing

=ImportData("https://raw.githubusercontent.com/J535D165/CoronaWatchNL/master/data-geo/data-municipal/RIVM_NL_municipal_latest.csv")


NB: 
The grey-columns are not from the CoronaWatchNL file, but extra columns that I added. E.g. column 'Municipality' (shown as 'City' in the GDS-report) replaces the '-1' value of the original column to 'ZZ Unknown'.

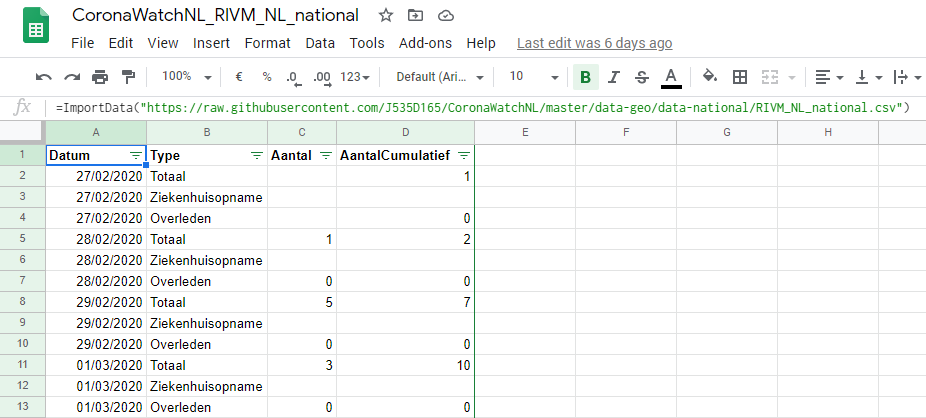
Datasource 2: RIVM_NL_national.csv

https://docs.google.com/spreadsheets/d/1Z9gWo6U3B_GIOsnewwNrqzASaNzW56-Y2hwi207_n3Y/edit?usp=sharing

=ImportData("https://raw.githubusercontent.com/J535D165/CoronaWatchNL/master/data-geo/data-national/RIVM_NL_national.csv")


NB:
*1: The datasources have 1 row per metric (see column 'Type'), and as there are 3 metrics, there are 3 rows per date and location (for datasource 1) or per date (for datasource 2). Therefore it's necessary to filter in the report or chart which metric-type you want to display. An alternative would have been to 'pivot' these 3 rows to 3 columns, so then there would be only 1 row per date and location (for datasource 1) or per date (for datasource 2), and so then the table would be like a 'normal' fact-table (in BI-terms). 
*2: In the datasource there are some records with negative numbers, which are corrections I guess. I choose to not plot them in the chart, as these are exceptions and could lead to confusion.

FIG.5: negative numbers (corrections)  in datasource


For the dashboard (4 GDS-reports), I enabled Google Analytics, so I can see the usage. Here you can see how this can be done:
https://datastudiotemplates.com/how-to-track-your-google-data-studio-report-usage-with-google-analytics/

One of the sharing options of GDS is by scheduled email. If you are interested in this, please let me know, and I can add you to the mail-list.

To conclude this post I wanted to say congratulations to Jonathan de Bruin and all other people who work on the CoronaWatchNL project, and keep up the good work!


Embedded Google Data Studio report

COVID-19 in the Netherlands dashboard (part 1/2) - Number of cases by province and city (Dark theme)


COVID-19 in the Netherlands dashboard (part 2/2) - Number of cases over time  (Dark theme)


Interesting Links about GDS

How to create a [Google Data Studio] dashboard for coronavirus:
https://www.youtube.com/watch?v=_CNnparrSgs

GDS-tutorial:
https://blog.hubspot.com/marketing/google-data-studio

https://michaelhoweely.com/2019/02/26/filtering-data-using-a-geo-map-region-in-google-data-studio/

https://geofli.com/blog/report-location-data/

https://stackoverflow.com/questions/23177356/how-to-force-new-google-spreadsheets-to-refresh-and-recalculate

https://hevodata.com/learn/google-data-studio-filter/