#13 Excel and relational
databases
NB: This post has some files (embedded in 1 zip), see ‘Downloads’ at bottom of page.
In my previous post:
I showed how you can calculate the medal-totals grouped by team, and I also said that this
calculation could be much simpler in SQL, the language used in
relational databases, like e.g. MS Access.
In this post I´ll show you how you can do this in MS Excel, so in a
spreadsheet-program. This is useful for those who don´t have an MS
Office-version which includes MS Access.
The general idea is
to split the application in 2 layers (2
Excel-files): the database-layer and the client-layer, like in a
client/server-application.
The database has data about
skaters, races and teams. Each type of data
is put in it´s own table and between the tables exist relations as
you can see in fig.1, e.g.: a team consists of 1 or more skaters
and a skater participates in 1 or more races. The tables are linked by their primary keys (PK) and foreign keys (FK), columns which end with ID, e.g. TeamID (PK of table Team and FK of table Skater).

fig.1: Tables in database
The data in these
tables you can see in fig.2 and file Skating_DB_XL.xlsx, which is
an Excel-workbook with 3 worksheets, one for each table.
NB:
I also made this database in MS Access for illustration-purposes, see
fig.3 and file Skating_DB_AC.accdb

fig.2: Excel-file with database

fig.3 Access-file with database
To be able to use
these 3 tables in this Excel-file (´database-layer’) in another
Excel-file (the ‘client-layer’), you must create a ‘Range’
for each table, see fig.4 and these sites how to do it:
http://office.microsoft.com/en-gb/excel-help/define-named-cell-references-or-ranges-HP005201536.aspx

fig.4: Named Ranges for tables in database
In the Excel with
the client-layer, you now must create a connection to the Excel with
the database-layer, which is stored in a
dqy-file (Excel ODBC Query), see these sites how to do this:
With
the connection to the database created, you now can use Excel Query to create your
queries to the database, using the Query Wizard (see fig. 5-6) or hand-written SQL (see fig.7 etc.)

fig.5: Excel Query

fig.6: Excel Query with result
Some examples of database queries in SQL:
* Example 1
File:
Skating_XL_Query2b.xlsx, Skating_XL_Query2.dqy
Query: ranking for
all skaters in top 3 and pivot-table
SQL:
SELECT
T_Race.SkaterID,
T_Skater.Gender, T_Skater.SkaterName,
T_Team.TeamID, T_Team.Trainer, T_Team.TeamName,
T_Race.Race, T_Race.Ranking
T_Skater.Gender, T_Skater.SkaterName,
T_Team.TeamID, T_Team.Trainer, T_Team.TeamName,
T_Race.Race, T_Race.Ranking
FROM
`C:\Temp\Skating_DB_XL.xlsx`.T_Race T_Race,
`C:\Temp\Skating_DB_XL.xlsx`.T_Skater T_Skater,
`C:\Temp\Skating_DB_XL.xlsx`.T_Team T_Team
WHERE T_Race.SkaterID = T_Skater.SkaterID
AND T_Skater.TeamID = T_Team.TeamID
AND T_Race.Ranking <=3
`C:\Temp\Skating_DB_XL.xlsx`.T_Skater T_Skater,
`C:\Temp\Skating_DB_XL.xlsx`.T_Team T_Team
WHERE T_Race.SkaterID = T_Skater.SkaterID
AND T_Skater.TeamID = T_Team.TeamID
AND T_Race.Ranking <=3

fig.7: Result query
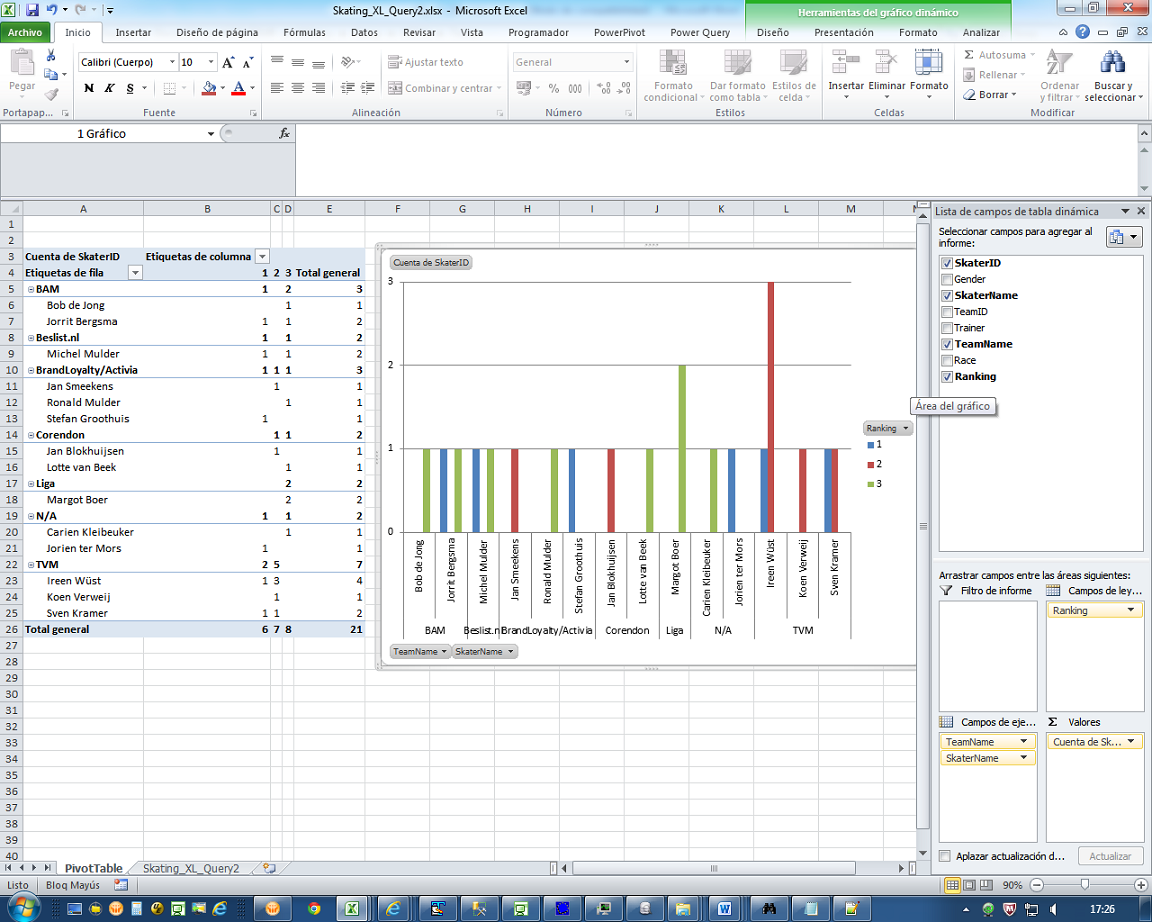
fig.8: pivot table based on result query (fig.7)
*Example 2
Files: Skating_XL_QueryXL_6b.xlsx,
Skating_XL_Query6.dqy
Query: medal-total per
team
SQL:
SELECT
Sum(IIF(T_Race.Ranking=1,1,0)) AS 'Total_Gold',
Sum(IIF(T_Race.Ranking=2,1,0)) AS 'Total_Siver',
Sum(IIF(T_Race.Ranking=3,1,0)) AS 'Total_Bronze', Sum(IIF(T_Race.Ranking=1,1,0))+Sum(IIF(T_Race.Ranking=2,1,0))+Sum(IIF(T_Race.Ranking=3,1,0)) AS 'Total',
T_Team.TeamName
FROM `C:\Temp\Skating_DB_XL.xlsx`.T_Race T_Race,
`C:\Temp\Skating_DB_XL.xlsx`.T_Skater T_Skater,
`C:\Temp\Skating_DB_XL.xlsx`.T_Team T_Team
WHERE T_Race.SkaterID = T_Skater.SkaterID
AND T_Skater.TeamID = T_Team.TeamID
AND ((T_Race.Ranking<=3))
GROUP BY T_Team.TeamName
ORDER BY Sum(IIF(T_Race.Ranking=1,1,0)) DESC, Sum(IIF(T_Race.Ranking=2,1,0)) DESC, Sum(IIF(T_Race.Ranking=3,1,0)) DESC, T_Team.TeamName

fig.9: Result query
Note 7-5-2014:
I wrote a new post with more examples on the Skating-database in this post, using PowerPivot and PowerView, see:
http://worktimesheet2014.blogspot.com.es/2014/05/excel-2013-and-business-intelligence.html
Download-mirror: