10 Jun 2025

End-to-end analysis of participants race Cross de Invierno 2023 with Microsoft Fabric (and Power BI)

 #91 End-to-end analysis of participants race Cross de Invierno 2023 with Microsoft Fabric (and Power BI)

In this old post I wrote about the run Cross de Invierno 2023 in Madrid I which I participated, which included an analysis of the finish-times, in Excel.
In this new post I used the data of the this run again, but this time for an analysis of the participants of schools and athletic-clubs, and now I used Microsoft Fabric. 
Fabric is Microsoft's quite new SAAS data analytics platform (it went GA in Nov.2023). It's a suite of tools to facilitate end-to-end analysis of data, and includes Power BI, One Lake, Data Factory (Data Pipeline, Dataflow), Synapse Warehouse and Lakehouse, Spark Notebooks etc. Fabric is made for 'personas' as Data Engineer, Data Scientist, Business Analyst etc., for which there are different built-in workloads ('experiences').
For more info about Fabric, see e.g:

https://learn.microsoft.com/en-in/fabric/get-started/microsoft-fabric-overview

https://youtu.be/J4i5lcROJcs?si=ZPo-mgnmQx8eRPg2
NB: in min. 19:16 there's a good picture of the Fabric architecture.

Evolutionary History of Microsoft Fabric - Spreadsheets to Lakehouse


The Power BI report that I made has these race-participants stats:  


The results of the race are published in several PDF-files, and for my analysis, I used 2 files, with the results of all men and women, so all adults (categories senior and junior). I converted these PDF-files to Excel and uploaded them in my Onedrive. I then used a Data Pipeline with 'activity' Dataflow Gen2 (with PowerQuery) to load the data from the Excel-files into a (Synapse) Lakehouse:


A Lakehouse is a data asset of OneLake, the central storage place of all data loaded in Fabric. 
All data in OneLake is stored in the Delta Parquet format, an open data format that can be read by all engines in Fabric (e.g. Power BI, using Direct Lake mode), which looks like this :

https://parquetreader.com/ 


NB: 

-note that the files are in the OneLake-folder, the 'OneDrive for data', see:
https://youtu.be/4NbuG1JBq60?feature=shared

-for more info about Onelake, see:
https://radacad.com/what-is-onelake-in-microsoft-fabric-and-why-you-should-care

-for more info about Delta Parquet format, see:
https://data-mozart.com/parquet-file-format-everything-you-need-to-know/


I made a Notebook to query the tables that I created in Onelake (Lakehouse), using the pyspark Python-library:  


And another notebook with the sempy-Python library. with which a PowerBI semantic model can be queried, using DAX: 


I created in a Fabric Warehouse the view RunnersAll, to combine the data from the 2 tables MenAll and WomenAll, with this SQL (run in the LakeHouse's SQL-endpoint):


In Fabric there's a Visual Query Editor (PowerQuery) that can generate the SQL for you, here an example to get a list of all teams of both men and women runners: 


And the generated SQL:


Note that in this (generated) SQL "DISTINCT .. UNION ALL" is used, where I would have used UNION (which filters out the duplicates, no separate DISTINCT needed).
 

I made some other (dimension-)tables that I then added in this Power BI Semantic Model (star-schema):


And this model was the source for this Power BI report:


The table in this dashboard (PBIX-report) with the details of the runners is a long list to scroll through.
A better way to show (long) lists are paginated reports (RDL-report). There are 2 ways to make a paginated report: 
 

*1: in the Power BI Service, using the semantic model, and a query in DAX: 


*2: in Power BI Reportbuilder, using the SQL-endpoint of Fabric Lakehouse/Warehouse, and a query in SQL (report shows top 3 runners per category):


The query for the dataset in this report can be made in SQL or the Query Designer (that generates SQL):


NB: for a good post about PBIX-reports ('dashboards') vs RDL-reports ('classic' paginated reports), see:

https://sqlserverbi.blog/2022/02/04/when-to-use-paginated-reports-vs-interactive-power-bi-reports/  


To see if the schools that participated in the run were all coming from my neighbourhood (Ciudad de los Poetas) where the race was held (park Dehesa de la Villa),  I made this PBIX-report:

MS Fabric supports version-control in Git, see column Git-status 'Synced' : 


I worked on this project in Dec.2023 and Jan.2024 (with a free Fabric trial license), so shortly after 
MS Fabric went 'GA', although actually it was still a beta-version back then... But what is the status now, in Jun.2025, is MS Fabric 'production-ready' now? It looks it still isn't:

https://www.brentozar.com/archive/2025/05/fabric-is-just-plain-unreliable-and-microsofts-hiding-it/ 

https://www.linkedin.com/posts/gregdeckler_mshgqm-is-microsoft-hiding-fabrics-flaws-activity-7331365183698698243--9iE/

Microsoft Hates Greg - MS Fabric Performance & login issues

Microsoft Fabric: 10 Reasons It’s Still Not the Right Choice in 2025 

And is Microsoft's idea to bundle all their data-tools (as Power BI and Azure Synapse) in one suite (Fabric), a good idea? Some more critical opinions:

https://www.linkedin.com/pulse/microsoft-fabric-repeating-sins-past-greg-deckler-mrrae

Curbal - I can explain Microsoft Fabric with ONE WORD


I googled with "MS Fabric (customer) success stories 2025" and "MS Fabric market adoption 2025", and found e.g.: 

https://www.reddit.com/r/MicrosoftFabric/comments/1jz4dxz/microsoft_fabric_success_stories/ 

https://news.microsoft.com/en-au/features/melbourne-airport-is-driving-innovation-across-operations-with-microsoft-fabric-for-data-analytics-and-reporting/

https://www.microsoft.com/en/customers/story/23991-lumen-microsoft-fabric 

https://www.reddit.com/r/MicrosoftFabric/comments/1fne380/seeking_insights_on_microsoft_fabric_adoption/

https://powerbi.microsoft.com/en-us/blog/microsoft-named-a-leader-in-the-2024-gartner-magic-quadrant-for-analytics-and-bi-platforms/ 

MSHGMQ - Microsoft Fabric and the Uncanny Valley 

As they say in this post:

https://www.red-gate.com/simple-talk/databases/sql-server/bi-sql-server/microsoft-fabric-the-land-of-wizards-and-trolls/?utm_source=pocket_shared 

 "Only time will tell if Fabric stands the test of time against competitive technologies.[e.g. Databricks or Snowflake]." 


If you enjoyed this post and want to make a small donation, you can do this with the Paypal Donate button (at the top right of this post) or via BuyMeAcoffee .

Follow me on LinkedIn


Downloads

PowerBI Report Runners-count 

PowerBI report Schools of runners 

Paginated report Runners 

Excel-export Paginated report Runners 

Notebook pyspark

Notebook sempy


18 Nov 2024

Power BI dashboard Rafael Nadal's Grand Slam tournament finals in whole career (2001-2024)

#90 Power BI dashboard Rafael Nadal's Grand Slam tournament finals in whole career (2001-2024)

Recently Rafael Nadal, one of the GOATs of tennis, announced that he will retire (at age 38).
His last tournament will be the Davis Cup in Nov.2024 in Malaga (Spain).

In 2014, I made an infographic (in MS Excel) about Nadal's win/loss records, see this blog-post.
And now, 10 years later, at the end of Nadal's career, I made a dashboard with MS Power BI, with the result of all Nadal's Grand Slam finals (#30) in his 23 years-career (2001-2024), finals that he played between 2005 (when he won his 1st Grand Slam tournament, at age 19) and 2022.

 
NB: The embedded version of this Power BI dashboard, you can find at the bottom of this post.

The dashboard is interactive, e.g. you can filter on all Nadal's Grand Slam wins (22):


Or you can 'drill-through' from a chart in the dashboard to the table with the underlying details, e.g. in chart "Finals by Tournament and Result", for tournament = 'French Open' :


And this is the complete table, so with all Nadal's Grand Slam finals: 

NB: I tried to make this table look like the datasource:
https://en.wikipedia.org/wiki/Rafael_Nadal
so e.g. with conditional formatting on the result-column.

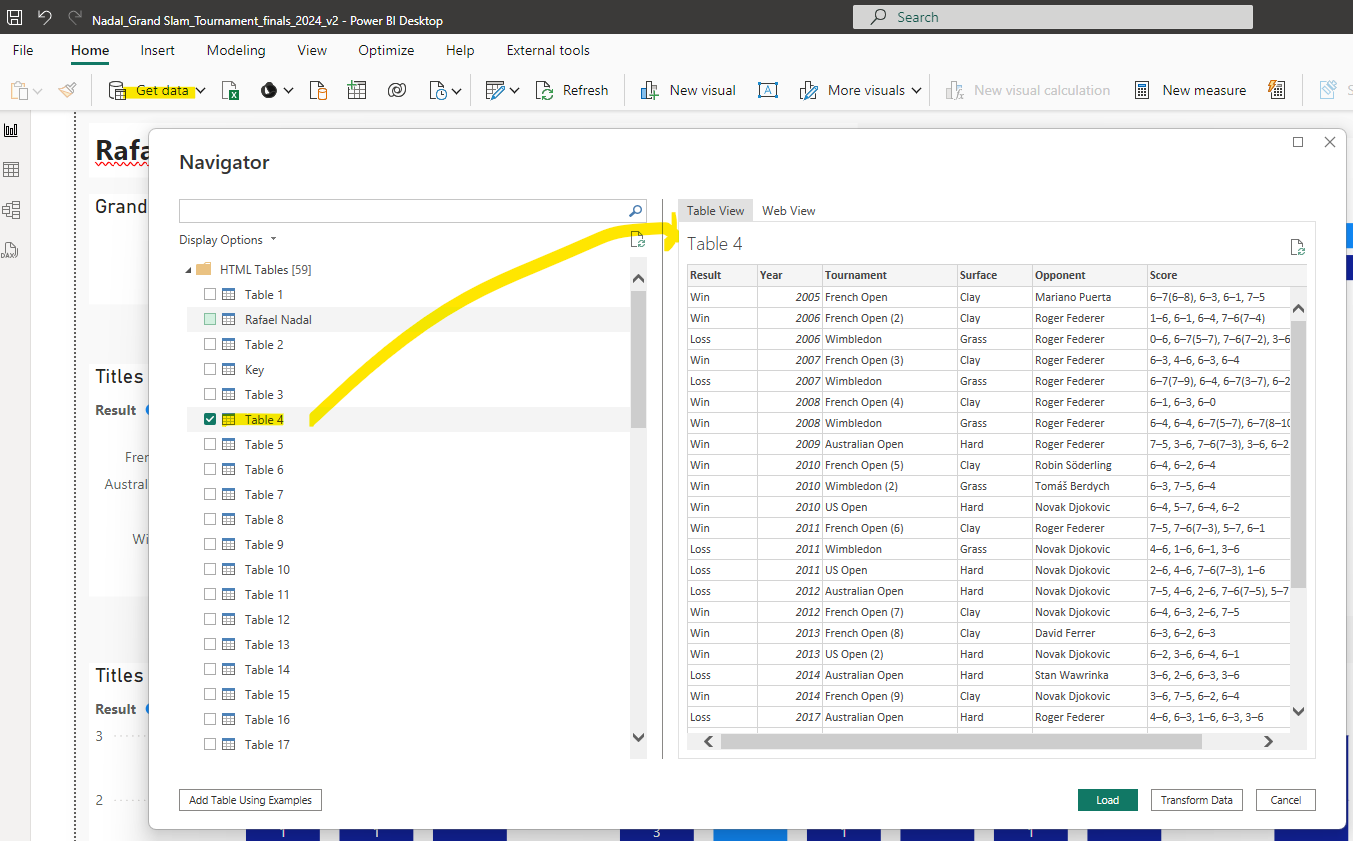
I used Power BI's webscraping feature ("Get Data > Web") to load the data from this Wikipedia source into Power BI.

I added some bookmarks in the dashboard to facilitate 'data storytelling', and I made a video of this data-story, see:

https://youtu.be/sy1yfUkRy90


Here some facts that this dashboard/video shows:

(Page 1 of dashboard)

*FACT 1: Grand Slam finals played by Nadal: 30, wins: 22, losses: 8

*FACT 2: Nadal played 9 finals against Roger Federer. And the other opponent he met often (also 9x) in a  final was Novak Djokovic (who has 24 Grand Slam titles until now, so 2 more than Nadal).
Here the chart with the win/loss details of Nadals finals against these other 2 tennis-GOATs, in Spotlight-mode:


*FACT 3: Nadal played and won 14 finals of the French Open (Roland Garros), which is played on clay, his favorite surface. No other winner of the French Open comes close to this. Bjorn Borg is 2nd in the Roland Garros-winners ranking, with 6 wins, as this chart generated by ChatGPT shows:


NB: this is the Python-code of ChatGPT's analysis:


And ChatGPT gave also this other fact about Nadal's 14 Roland Garros wins:


*FACT 4: 2010 was Nadal's best Grand Slam year: he played 3 finals (French Open, US Open and Wimbledon), and won all 3.
NB: I added a (special) custom tooltip to chart "Finals by Year and Result", so that you can see more details of these finals:

(Page 2 of dashboard)

*FACT 5: Of the 14 finals of the French Open that Nadal played, most were against Federer: 4 finals
 
*FACT 6:  Nadal played against Djokovic in the finals of all 4 Grand Slam tournaments, in total 9 finals (wins: 5, losses: 4):
 -French Open, wins: 3
 -US Open, wins: 2, losses: 1
 -Australian Open: losses: 2
 -Wimbledon: losses: 1

*FACT 7: Nadal won all 4 Grand Slam tournaments in his career. He reached this 'career Grand Slam' in 2010:


*FACT 8:  What is maybe not so easy to see in my Power BI dashboard about Nadal, is the fact that there were 3 years that Nadal did not play any Grand Slam final: in 2015 and 2016 (after having played in the previous 14 years at least 1 Grand Slam final each year) and in 2021. I made another dashboard where I enriched the data from the original Wikipedia-datasource with these 3 years:

NB: This post explains more about the reason why in 2015-2016 Nadal had a weak period:

https://www.reddit.com/r/tennis/comments/twiyqf/
nadals_weakest_years_20152016_and_the_reason_for/?rdt=60942

But Nadal came back, and won again 4 years in a row: in 2017-2020 6 Grand Slams and 2 more in 2022.

When I saw that ChatGPT could make the Roland Garros winners chart (see FACT 3 above), I was wondering if it could also create a dashboard with multiple charts:

But Power BI can auto-generate a report/dashboard (using built-in AI), and here you can see the result for my Nadal-dataset, where I marked with green the charts that I think are useful (and with red those charts that are not).

So I think this proves that AI can't replace a (human) data-analyst. I also asked ChatGPT about this:

I wanted to see how good Power BI's AI feature 'autocreate report' was, but I was disappointed, it looks to take some random permutations of the different attributes to slice the measure, I guess because it doesn't know about the underlying concepts, as a human does, is this true?

And here's GPT's answer:


And I also liked GPT's alternative response, which includes this:


I used GPT also for a review of my Power BI dashboard, for which I made a screenshot of the dashboard and attached this file in my prompt ('please review my dashboard, see attached file'):


Even though Nadal will stop with tennis soon, the future of Spanish tennis looks bright with Carlos Alcaraz, who already won 4 Grand Slams at the age of 21, and of which Nadal said: "he's going to be one of the best in history" (see this post). 
I asked GPT to plot a chart with Nadal's and Alcaraz's number of Grand Slams per age, here the result (after some iterations/mistakes by GPT):

NB: See also this post:
How many Grand Slams had Rafael Nadal won at Carlos Alcaraz’s age? - AS USA
 

I hope that  Nadal will play in the Davis Cup and  that he's in a good shape (no injuries..), and it would be very nice if Nadal and Alcaraz would play together in the double.


Adios Rafa, 'King of Clay', 'Icon of Perseverance' ,   'Raging Bull' / 'Torro Furioso' / 'Torro Bravio'


If you enjoyed this post and want to make a small donation, you can do this with the Paypal Donate button (at the top right of this blog-post) or via BuyMeAcoffee .

Follow me on LinkedIn


References

Nadal

Marca.com - Rafael Nadal announces his retirement... the end of an era

BBC - 'King of Clay' Nadal's career in numbers

https://olympics.com/es/noticias/retirada-rafael-nadal-todas-las-estadisticas-y-titulos

www.statista.com - Rafa's Road to 22

https://community.jmp.com/t5/Abstracts/Who-is-the-GOAT-of-Men-s-Tennis-Tennis-Data-Analysis-and/ev-p/738890?utm_source=pocket_reader

MS Power BI Data Stories Gallery - Tennis Analytics - How Rafael Nadal won his 21st Gran Slam title at the Australian Open final

Nadal's career in 21 sec.

Rafael Nadal - All 22 Grand Slam Wins | Championship Points   

Rafael Nadal's Most ICONIC ATP Career Moments

The Story of Rafa Nadal's Unbelievable Career

https://www.tennis.com/news/articles/rafael-nadal-records-that-may-never-be-broken-no-3-a-career-golden-slam-at-age-24-retirement-stats 


Power BI

Make Your Power Bi Reports Pop With Custom Tool Tips!

How to use Power BI Bookmarks for data storytelling


Downloads

PowerBI report Rafa Nadal Grand Slam tournament finals 

PowerBI report Rafa Nadal Grand Slam tournament finals v2 (with no-finals years)

Power BI dashboard (embedded)

https://community.fabric.microsoft.com/t5/Data-Stories-Gallery/Power-BI-dashboard-Rafa-Nadal-s-Grand-Slam-tournament-finals-in/m-p/4287792#M13505


19 Jun 2024

PowerBI-report UEFA Champions League Titles by Team, history (seasons 1955-56 to 2023-24, winner: Real Madrid)

#89 PowerBI-report UEFA Champions League Titles by Team, history (seasons 1955-56 to 2023-24, winner: Real Madrid)


On 1/6/2024, Real Madrid won the UEFA Champions League (UCL) final from Borussia Dortmund, and with this its 15th UCL-title (!).

I made a Power BI dashboard with all teams that won the UCL (before 1992 called European Cup), from the first season, 1955-56 until now (season 2023-24), here some screenshots.
NB: at the bottom of this blog-post I included the dashboard (embedded, interactive version) + download-URL.


With filter on Country = Netherlands (country #4 in ranking #UCL-victories per country):


You can do a drill-through for Real Madrid (-bar) to see the details of all Real Madrid's UCL-victories:


To see how Real Madrid got to these 15 UCL-titles over time, I made a chart with the cumulative # titles.
In this chart you can see e.g. that Real Madrid won the first 5 UCL-finales in a row (with Real Madrid -legend Di Stefano).


NB: The DAX-formula for measure cumulative # titles, I got with help from ChatGPT:


With this decomposition tree chart, you can see a breakdown of the 15 UCL-titles, where I chose the path:  Country (Spain) > Team (Real Madrid) > Coach (Ancelotti, trainer with most UCL-victories, total 5, 3 with Real Madrid and 2 with AC Milan) and Season/Year (2023-24)


To make a Power BI dashboard as this, normally I'd search for the dataset on internet, e.g. Wikipedia, and then transform the dataset for my reporting-needs (e.g. in Power Query). But now there are generative AI tools/chatbots as OpenAI's ChatGPT,  which I used, that can create the dataset you want, or close to it.
For the dataset that ChatGPT generated for me, it missed data for UCL season 2023-24, because ChatGPT has a cutoff date of Jan.2022, so the data for that season I had to add manually.
ChatGPT created some Python-code for the dataset, which can be loaded in Power BI (as it also told me):


I also asked ChatGPT which visual it would recommend for this data, and it even draw the chart itself (something that was not possible with ChatGPT 3.5, but now with ChatGPT 4o it is):


So these new AI-tools can make the life of a data-analyst and data-journalism work as I did for this post much easier, until one day we are not needed anymore..


If you enjoyed this post and want to make a small donation, you can do this with the Paypal Donate button (at the top right of this post) or via BuyMeAcoffee .

Follow me on LinkedIn


References / Youtube-videos UEFA Champions League (European Cup) history (season 1955-56 to 2023-24)

ALL Champions League goals 2023/24 | Real Madrid

Best Champions League Goals In Football History (2000-2024)

European Cup final 1960 | Real Madrid 7-3 Eintracht Frankfurt

Feyenoord - Celtic 2-1 Europa Cup I Milaan, 6 mei 1970

Ajax wins 1972 European Cup Final

Borussia Dortmund 0-2 Real Madrid | HIGHLIGHTS | Champions League final 2023/24


Downloads

PowerBI report with Champions League history until season 2023/24


Power BI dashboard (embedded)

https://community.fabric.microsoft.com/t5/Data-Stories-Gallery/PowerBI-report-UEFA-Champions-League-Winners-history-seasons/m-p/4000701#M12714