NB 31/3/2020:
Since today, this report is not daily updated anymore, because the format and content of the source-data (RIVM CSV file) has been changed and I haven't adopted my reported for this. In case you are interested in this, please let me know in a comment on this post.
NB: the embedded report is at the bottom of this page,
The Coronavirus (COVID-19) Power BI report that I made and wrote about in my previous blog-post:
http://worktimesheet2014.blogspot.com/2020/03/coronovirus-in-netherlands-power-bi.html
, I embedded in this new blog-post, so you can see every day the latest numbers. The data in this report get's refreshed daily at aprox. 14:00, when RIVM (National (Dutch) Institute for Public Health and the Environment) made the new Coronavirus-numbers in the Netherlands available again on their website:
https://www.rivm.nl/coronavirus-kaart-van-nederland-per-gemeente
and after this CSV file was processed by Jonathan de Bruin (Research Data Engineer at Utrecht University) and made available for the public on:
https://github.com/J535D165/CoronaWatchNL
How to embed a PowerBI report in a web-page is described here:
https://powerbi.microsoft.com/en-us/blog/easily-embed-secure-power-bi-reports-in-your-internal-portals-or-websites/
The embedded report below is interactive, so you can do everthing here as you would do when you work in Power BI itself, e.g. filter, drill-down etc.
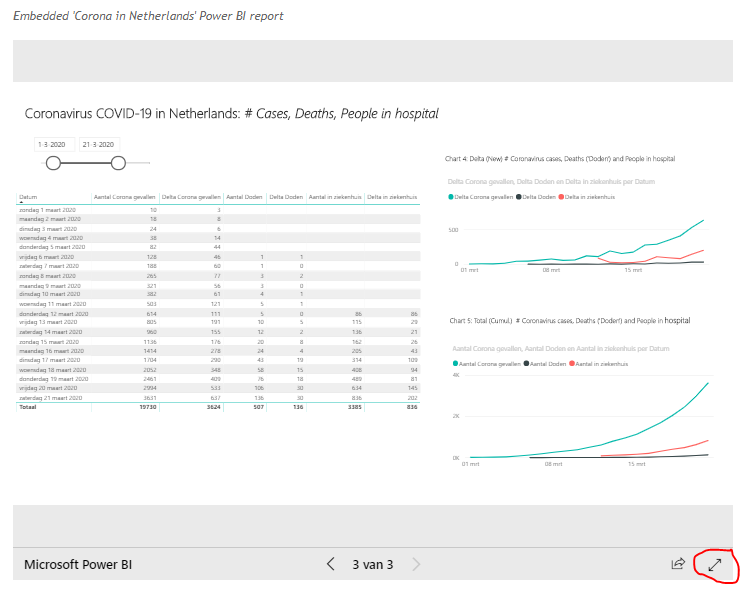
Hint: when you view the report in your web-browser, use mode 'Open in complete screen' (see red-marked icon in bottom-right icon in fig.1).
Power BI has also a community where members can share their work, which I also did for my Corona-report (under user-name: maartenree), see:
https://community.powerbi.com/t5/Data-Stories-Gallery/Covid-19-in-the-Netherlands-visualising-the-RIVM-data/m-p/985506#M3539
For more details about the report and the PBIX-file (PowerBI), see my previous post.
HTML (iframe) of today's report (in case you want to embed it in your webpage:
<iframe width="800" height="600" src="https://app.powerbi.com/view?r=eyJrIjoiZjVkOWQ4MzYtM2Q5Yi00MWI0LTllNGYtNDFiY2EyYzgzYjI4IiwidCI6ImI3OWIyMzE3LTM0ZGQtNDNlNS05MWEyLWNkNjZkM2FlMWYwYiIsImMiOjh9" frameborder="0" allowFullScreen="true"></iframe>
Embedded 'Coronavirus in Netherlands' Power BI report
1 comment:
That's great, Thank you Maarten!!
Post a Comment