#81: Power BI dashboard with Flow Map Ukraine-refugees and Map NATO-countries
Today is the 18th day of the war between Ukraine and Russia and there are now 2.6 Ukraine-refugees.
In my previous blog-post, there was a live-tracker of the number of refugees based on this page, and I saw it was not updated, but that is fixed now. I also added some elements to the report, and some more details to that post.
In this post I wanted to combine the Flow Map of this live tracker report with the report'
'NATO-countries Map from this post.
Combining reports (or elements of it) is something you can do with Dashboards
Here is the result:
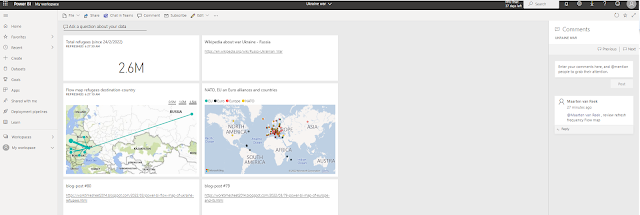
You can also add tiles with other things than a link to a report, see e.g. the tile with a link to:
https://en.wikipedia.org/wiki/Russo-Ukrainian_War
See also the sample-comment I made, and by using a tag @.., an email is send to that person.
Update 15/3/2022:
I just saw that the Power BI report on the UNHRC data-portal changed the visualization from bubble-map to flow-map, and a nicer one than that of the custom-visual I used:

PEACE TO UKRAINE !

source pic:
References
https://www.unhcr.org/nl/2022/03/dataportal-cijfer-vluchtelingen-oekraine/
https://news.sky.com/topic/data-and-forensics-9532
https://www.youtube.com/watch?v=yzNxLzFfR5w - Winter on Fire: Ukraine's Fight for Freedom | Full Feature | Netflix
No comments:
Post a Comment